Here is a graphical presentation of the weather in Hereford* in 2022 [*as recorded by my Davis Weather Station]. Click on each plot for a larger image.
First, the daily average, maximum, and minimum temperatures [note: differing temperature scales]. Note, in particular, the number of days (10) when the temperature reached or exceeded 32 ℃ (definitely not normal!), the two cold snaps in January and December (both about 10 days long), and the last frost on April 10th.
It is all very well to record the actual temperatures but, perhaps, of greater interest is how hot or cold it feels outdoors as this will influence how we dress, what activities we do, etc. This is where the THSW Index comes in. At a basic level, measuring temperature and humidity allows a Heat Index to be calculated to provide an 'apparent' or 'perceived' temperature. Since wind has a cooling effect (chill factor), a better estimate of 'perceived' temperature would include this wind factor - hence the THW Index (the 'apparent' outdoor temperature in the shade. Air temperatures are recorded using shaded thermometers, e.g. housed in a Stevenson Screen, to avoid solar radiative heating of the temperature-measuring instrument (e.g. glass thermometer). As we all know, it feels warmer in the sunshine than the shade so we need to include a sun factor to have a more realistic perception of how warm it feels when outdoors enjoying the sunshine. This is where the THSW Index come in.
The plot below shows the daily maximum THSW Index for Hereford throughout 2022. Note, in particular, that 'apparent' temperatures reached 40 ℃ or more on three occaisions in 2022: twice in July and once in August with a highest 'perceived' temperature of 43 ℃ (also known as unbearably hot!)
The next plot (below) shows both the high THW (green) and high THSW (red) indices demonstrating the benefits of staying in the shade during the summer months and getting out into the sunshine during the winter months. Shade reduces the 'perceived' summer temperatures by about 7 ℃ whereas sunshine increases 'apparent' winter temperatures by 2 - 3 ℃ when the sun is lower in the sky.
Temperature variation throughout the year can also be visualized in terms of heating and cooling degree days. A heating degree day measures how much (degrees) and for how long (days) the outside temperature is below a base temperature level; i.e. when heating will be needed. A cooling degree day measures how much and how long the outside temperature is above the same base temperature; i.e. when cooling is required. This information is useful in deciding the appropriate size of a heating/cooling system and for monitoring energy use. In the UK, the base temperature 15.5 ℃ whereas in the US it is 65 ℉ (18.3 ℃).
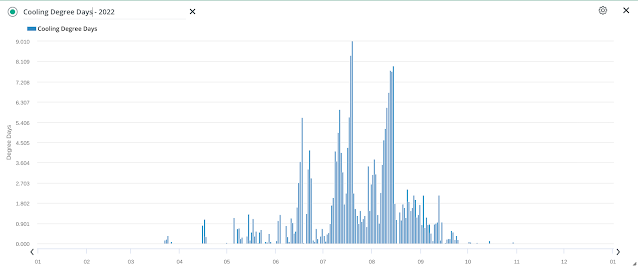
In the UK, we are generally concerned only with heating degree days since, for most residential properties, summer air conditioning involves opening windows, closing curtains, and (in extreme heat) using an electric fan! In any case, both heating and cooling degree days for 2022 in Hereford are shown below. I suspect the base temperature used for these graphs is 65 ℉ (the US standard); I'm checking with my supplier whether this can be changed.
No real surprises here. The peak in the December heating degree days coincides with the cold snap experienced at the end of last year and the summer cooling degree days peaks correlate exactly with the highest daily maximum temperatures.
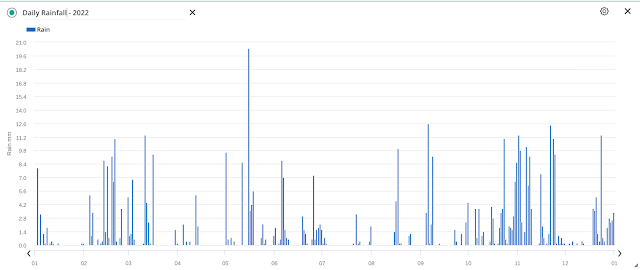
The amount and frequency of precipitation events (rain, if you like) are shown next. Note that the cold snaps coincided with dry spells hence, as far as I can remember, no snow to speak of in 2022.
Let's now take a look at Daily Solar Radiation values measured in Watts per metre-squared. I use average daily solar radiation as a proxy for sunshine hours in my monthly reports. Generally, we would expect a Gaussian or Normal distribution for both measures of solar radiation with a 'peak' around the summer solstice. Gaps indicate periods of cloudy weather (with or without precipitation).
Our final plot considers daily maximum UV indices. Values between 0 -2 (bottom two rows) are considered low risk for the 'average' person meaning January - March and October - December were low risk for Hereford residents in 2022.
An index rating of 3 - 5 (rows 4 & 5) presents a moderate risk where avoiding the midday sun, protective clothing, sunscreen and sunglasses are highly recommended. For Hereford in 2022, this index rating covered the months of April to September inclusive.
June and July are the high risk months as the UV Index hits 6 - 8 and occasionally 9. Stay in the shade between 10 am and 4 pm or avoid going outside! Don't forget sunscreen, protective clothing and sunglasses! Enjoy the early mornings and cooler evenings where possible!
My Davis Weather Station is a Vantage Pro2 Plus with an additional AirLink particulate monitor. Data are collected continuously by a 6100 Weatherlimk Live unit for automatic upload to the Davis Weatherlink.com cloud platform for archiving in 15-minute packages. Live data can be viewed via the mobile app with more detailed information available via a browser (Chrome on a Chromebook in my case) as this screenshot shows ...
Limited graphing capabilities are included in the browser app; for example, these plots summarise mean, maximum, and minimum daily temperatures for the whole of 2022.
The app is very easy to use but downloading the graphs is only possible via screenshots and there are times when a little more flexibility in the graphing capabilities would be useful. Davis will send your data on request should you wish to use third-party software programs such as Cumulus or Weather Display.
Previously, in January 2021, I looked at how annual temperatures have changed in Herefordshire over the 1931-2020 time period using UK Met Office data from their weather station in Ross-on-Wye. I can now add a further two years to this dataset and replot the mean annual temperatures ...
Annual Temperatures (℃) for Ross-on-Wye (1931 - 2022)
[NB: Annual mean temperatures calculated by averaging monthly maximum and minimum temperatures (Tmax+Tmin/2). This is not optimum but is the best I can do with the data provided by the Met Office. I have made no allowance for the different number of days in the months of the year when estimating annual mean temperature but is not a minor error. If I ever have enough spare time to do a 'proper' job then I will be truly amazed but I am prepared to give it a go if I have the data!!]
The Central England Temperature (CET) data set, maintained by the UK Met Office Hadley Centre, is the longest instrumental temperature record in the world; daily and monthly temperature values have been recorded from 1772 and 1659 respectively. The CET data covers an approximately triangular area from Bristol to London to Manchester ...
Area covered by the Central England Temperature (CET) data set
Both Hereford and Ross-on-Wye lie just outside the CET area but they are near enough for the CET data to be a good proxy for Herefordshire temperatures and local warming trends. This can be seen very clearly by comparing the annual mean temperatures for Ross-on-Wye (top of the page) with the equivalent CET results (below) for the 1931 - 2022 period.
Annual CET Data (1931-2022)
My Davis Weather Station has been running for just over three years collecting weather data every 15 minutes. So how do the temperatures recorded by my weather station compare with similar data collected from the nearby Ross-on-Wye Met Office station and the more geographically extensive CET network?
Let's have a look! The following three bargraphs compare all three of the above datasets on a monthly basis (an annual mean is included for completeness) for the years 2020, 2021, and 2022.
Mean Monthly Temperatures (2020) from Davis Weather Station, Ross-on-Wye Met Office Weather Station and CET
Mean Monthly Temperatures (2021) from Davis Weather Station, Ross-on-Wye Met Office Weather Station and CET
Mean Monthly Temperatures (2022) from Davis Weather Station, Ross-on-Wye Met Office Weather Station and CET
From which we may conclude:
Excellent agreement between all three datasets
The Davis and the Ross-on-Wye Met Office Weather Stations show the closest agreement in temperature values.
There is a small bias towards higher temperatures for the Davis Weather Station - possibly an Urban Heat Island (UHI) effect
The CET values show good correlation with the other two datasets but with a clear bias to lower temperatures. Probably explained by the fact that the CET geographical area includes more northerly weather stations (see map above)
The longer (1931-2022) temperature datasets show a very clear warming trend in Herefordshire and Central England commensurate with the well-established trend in global warming noted in numerous IPCC reports.
Equally obvious is that the seasons here in Herefordshire are changing and becoming more variable which is not good news for gardeners and farmers alike. The weather data from my Davis Station only covers the last three years. Nevertheless, I hope to take a deeper dive into all the weather data to see if any trends are discernible and what this means for the future.
Citizen science projects are generally about collecting data, lots of data, often in a form suitable for analysis by more experienced researchers. Extra data are beneficial whether for the study of bird migration, the documentation of Super Nova explosions, digitizing handwritten meteorological observations, or counting the number of polar bears in the Arctic.
The weather data from the Davis Weather Station in our back garden is uploaded to Weatherlink.com and made publicly available. Just click the cross (+) in the top right corner of any craftycabbage.com page to get the current weather conditions in our garden.
In the near future, I hope to be able to automatically upload our weather data to WOW (the UK Met Office's Weather on Web platform) so it is available to weather and climate researchers.
However, you do not need an expensive weather station to be able to contribute. Everyone can put out a rainfall collector and monitor daily or weekly precipitation. Most homemade rainfall gauges are based on a clear plastic bottle modified with stuff readily found in most homes. See here, here, here, and here for examples. And there are plenty of YouTube videos as well.
A disadvantage of this type of rain gauge is its inaccuracy for small amounts of rain because the collection area is limited to the diameter of the bottle. Either reducing the diameter of the bottom collector or increasing the diameter of the upper collecting funnel would help improve accuracy for lower precipitation events. This, however, removes the simplicity of the original design and requires some additional adjustments to the raw data to obtain the correct rainfall values.
Knowing rainfall levels and patterns is important for one of the citizen science projects I'm currently involved with: FOUW river water testing. River Wye levels in Hereford are dependent, to a large extent, on rainfall in the Welsh Hills where the source of the Wye is. It can take one to two days for rain in Wales to percolate its way down to Hereford. On the other hand, the water levels in the tributaries we test are governed primarily by run-off from nearby agricultural land, gardens and paved surfaces (paths and roads). So knowing the local rainfall data are important in assessing the impact of different types of run-off.
One of our citizen science colleagues, who lives near the testing sites, has built his own rain gauge using a plastic bottle as described above. However, rather than measure the height of the collected rainfall, Alan weighs the bottle daily using standard kitchen scales (to the nearest gram). This provides good accuracy for even small quantities of collected rain but requires additional calculations to convert the mass of water to rainfall in millimetres (mm) - e.g. an accurate value for the rainfall collection area (aperture) is required.
Another option is to buy a readymade rain gauge that has already been calibrated. There is plenty of choice for under £10. I asked for this one as a Christmas present ...
Rain Gauge
Now you are probably asking why do I need a cheap basic rain gauge when I already have a high-tech calibrated gauge as part of my Davis weather station? So, I shall tell you why. When I compare my 'state-of-the-art' weather station rainfall values with those from Alan's homemade rain gauge, Alan's values are, pretty much all the time, higher. For example, one day I recorded 11.8 mm and Alan recorded 19.2 mm; the following day we both recorded 0.8 mm. Alan and I live about one mile apart - Alan south of the River Wye whereas we are north of the river.
There could be a number of reasons for the discrepancies: (i) my reading is wrong, (ii) Alan's reading is wrong, (iii) both readings are wrong, (iv) on average, it rains more at Alan's location south of the river, (v) the location of one or both of the rain gauges is non-optimum.
After careful thought, my inclination was to go with (v) - non-optimum positioning of my rainfall collector. We live in a built-up urban environment making it almost impossible to place the rain collector in an ideal position. Instructions for the correct positioning of the rain gauge vary depending on which website you visit. Generally, the rain gauge should be out in the open, off the ground but sheltered from the wind. See here, here, here, and here for example instructions.
My Davis rain gauge is situated about 2 metres above ground to minimise the rain shadow effect of the surrounding buildings. It is attached to a pole (on the north side of the rain collector) that extends above the rain collector and is not ideal - however, the prevailing wind direction is from the south west so it hopefully will have only a relatively minor influence on rainfall values.🤞
In order to test this hypothesis (i.e. the Davis rain gauge is an accurate measure of rainfall at this location), I will compare its values with those from my simple rain gauge. This will take some time as I will need to place the secondary gauge in various positions around the garden and compare results using both methods.
With the rain gauge placed in open ground in the kitchen garden ...
Site #1
... the measurements so far are reasonably close (within ~10%) but there is a clear trend for the Davis system to underestimate precipitation:
Davis Weather Station
Simple Rain Gauge
Rainfall during 2 - 3 January
2.8
3.0
Rainfall during 2 - 6 January
5.6
6.0
Rainfall during 2 - 7 January
10.2
11.5
Note: the cover of the rain gauge retains some water - an issue only for light rain. One user of this type of rain gauge suggested leaving the lid off - something I might consider at a later date.
Finally, I compared rainfall data for January (up to 10 pm on the 6th January) recorded by Davis Weather Stations within a 5 mile radius of our weather station. Values ranged from 3.6 mm to 11.6 mm with a mean value of 7.5 mm: our Davis weather station recorded a value of 6.8 mm. This year, precipitation has been in the form of local showers so some geographical variability is to be expected.
Mary & I both have scientific backgrounds - We met at the University of East Anglia (UEA) where Mary graduated with a degree, B.Sc (Hons), in Biological Sciences and I obtained a B.Sc (Hons). and Ph.D. in Chemical Sciences. Mary worked at the John Innes Institute in Norwich in the Applied Genetics department while I completed my doctorate. We then moved to Swansea where I did three years of postdoctoral research and Mary raised our first two children. We then moved to the outskirts of London where I worked as an analytical/research chemist at BP and, then, Intertek (about 30 years in total). Our final move was to Hereford while I was still a consultant for Intertek followed by retirement at 58 years old once I got fed up with the weekly rail/coach commute to/from London.
We have retained our interest in science. My general interests are mainly in chemistry and physics (e.g. climate change, weather) while Mary's are in macrobiology (e.g. ecology); there is a lot of overlap and we pair up for many of the activities. And this is why we are keen on Citizen Science projects.
Recently, we have both started river water testing. This involves the twice-weekly sampling of river water on a tributary to the River Wye in Hereford using the supplied kit ...
River water testing kit
White bucket with rope for obtaining a river water sample
Secchi tube for measuring water turbidity
Plastic syringe and jug for sampling the collected river water sample
HM Digital EC-3 Conductivity Tester (also measures temperature)
Chemical test kit comprising
Chemical Test Kit
HM Digital EC-3 Conductivity Tester, also measures temperature (bottom)
Aquachek Nitrate/Nitrite Test Strips
Hanna Phosphate Checker (colorimeter), 10 ml glass vials & reagent sachet
Data are uploaded via a phone app so the Environment Agency can access and review it; see below for an example of the data in graphical form ...
Our sampling point is at the confluence of Newton Brook and the River Wye. We sample every Wednesday and Sunday with two other citizen scientists, Maggie and Alan, who sample further upstream but close by. And there are lots of other citizen scientists sampling both the River Wye and its tributaries as part of the Friends of the Upper Wye (FOUW).
Why are we testing? The River Wye is being polluted with agricultural nutrient run-off, primarily from industrial poultry farms, in Powys and Herefordshire. See here, here, here and here for more background. The Wye is oft-cited as England and Wales's favourite river so it is imperative we protect it for future generations.
There are plenty of other citizen science projects, some more and some less energetic, that everyone can take part in. For example:
And if you are happy to sit in front of a screen and do a citizen science project in arts, history, science, nature, literature, language, medicine, space, social sciences, etc from anywhere in the world then definitely look up Zooniverse.
The above photo was taken at 11 o'clock on the 15th following a dip in overnight temperatures to -9 ℃. Note the frosted roofs just starting to thaw a little in the weak winter sunshine. The first six days of the month recorded average daily temperatures, followed by 10 days of freezing temperatures (mean daily temperatures at or below freezing point, 0 ℃).
The final 13 days of the month were well above the expected mean daily temperatures for December. A strange month indeed. The next photo was taken at 11 o'clock on the 30th of December which was warm (maximum daytime temperature = 13 ℃) and damp (2.6 mm rainfall) ...
30th December 2022
Jobs in the Garden
Pick final celery on 7th December
Harvest spinach, chard, red cabbage and cauliflower (7th) before big freeze
Bring onions inside from the drying shed (7th) before big freeze
Tidy up the kitchen garden after the big freeze. Lost quite a few plants!
Remove frosted leaves from spinach and chard - hope for regrowth if the weather warms
Mulch rhubarb plants
Maintain one HotBin for composting through the winter.
December 2022 Weather
General weather parameters for December 2022 are summarised below. The very cold spell in the second/third week meant that, overall, it was a below-average cold month though dry if not especially sunny.
December 2022
Weather Parameter
Value
Dates
Average Monthly Temperature
4 oC
Maximum Monthly Temperature
14 oC
19th
Minimum Monthly Temperature
-9 oC
15th
Number of Air Frost Days
12
Number of Hot Days (> 25 oC)
0
Monthly Precipitation
41.0 mm
Greatest 24 h Precipitation
12.0 mm
23rd - 24th
Number of Dry Days
13
Monthly Sunshine Hours (estimated)
37
Average Wind Speed
2 km/h
Highest Wind Speed
42 km/h
23rd
Maximum Barometric Pressure (Sea Level)
1030.5 hPa
1st
Minimum Barometric Pressure (Sea Level)
985.4 hPa
30th
Average Barometric Pressure (Sea Level)
1010.5 hPa
The monthly time series of daily minimum and maximum temperatures (below) illustrates the three 'periods' from 'normal' to 'cold' to 'mild'. Indeed, from the 19th December, the daily mean temperatures were about 4 ℃ above 'normal' December values.
In the garden, it was the severe and prolonged cold spell that killed off many of the less hardy plants in the garden and kitchen garden. We won't know until next year whether a major restocking will be needed.
Minimum and Maximum Daily Temperatures - December 2022
In what was a dry month, most of the rain fell in the latter part of the month when the weather was mild.
Daily Rainfall & Sunshine (Solar Radiation) - December 2022
My Davis weather station was installed in November 2019 with the first full month of data collected for December 2019. The next two graphs compare December's weather for the four-year period (2019 - 2022). December 2022 was significantly colder, on average, than the previous 3 years; largely as a result of the much lower daily minimum temperatures and more frequent air frost days.
December Temperature Data for 2019 to 2022 Period
Rainfall in December 2022 was similar to 2021 and less than 50% of the levels observed in 2019 and 2020. Sunshine hours in each of the four December months have been comparable as have the number of dry days and maximum windspeeds.
December Rain, Sun & Wind Data for 2019 - 2022 Period
The Met Office provide a summary of weather parameters for December 2022. The data only included values upto December 29 when I accessed the data - a full set for December will be available in due time. The following three plots show mean temperature anomalies, % average rainfall and % average sunshine hours for the UK - all relative to the 1991-2020 reference period. I have circled Herefordshire since this relates closely with the weather parameters from my weather station.
Herefordshire was significantly colder than normal, drier than normal with slightly above average sunshine.
Met Office Data: Mean Temperature Anomaly for Herefordshire (circled)
Met Office Data: % Mean Rainfall for Herefordshire (circled)
Met Office Data: % Mean Sunshine Hours for Herefordshire (circled)
Finally, a video and some photos from the garden in December. This video shows, very briefly, a long-tailed tit alighting from an old lettuce plant near the house. A small flock of these birds is often seen flying over or visiting the garden.
After an overnight frost (-4 ℃), the Paradise Garden and the Wild/Secret Garden ...
Paradise Garden (9/12/22)
Wild/Secret Garden (9/12/22)
The celeriac bed was also affected by the same overnight frost (8/9th December) ...
Celeriac after frost on 8/9th December
... but had recovered somewhat by the 11th of December ...
Celeriac two days later
... only to be clobbered again by a more severe frost (-9 ℃) four days later ...