The Weir Garden - First Visit of 2023

 The Weir Garden is a National Trust (NT) garden less than 10 minutes' drive away and is consequently our most visited NT property. A ten-acre 18th Century riverside garden renown for its spring bulb and flower displays. The Garden receives about 250,000 visitors per year. Here is an account of our visit in 2022 at about the same time of year.

Figure 1: The Weir Garden (28/1/23)

The snowdrops were not as advanced as last year but they still painted a pretty picture...

Figure 2: The Weir Garden Snowdrops (28/1/23)

Figure 3: The Weir Garden Snowdrops (28/1/23)

Figure 4: The Weir Garden Snowdrops (28/1/23)

There were occasional flowers of Winter Aconite, Lesser Celandine, Primrose and Cyclamen ...

Figure 5: Primrose at The Weir Garden (28/1/23)

Figure 6: Cyclamen at The Weir Garden (28/1/23)


Winter Heliotrope (Petasites fragrans) was in flower providing a valuable nectar source for early insects and bees ...

Figure 7: Winter Heliotrope at The Weir Gardens (28/1/23)


whilst its native 'relative' Butterbur (Petasites hybridus) will not flower until early Spring ...

Figure 8: Butterbur at The Weir Garden (28/1/23)

Birdwise, it was fairly quiet but did include, some 400 metres away, this heron on the banks of the River Wye and seemingly oblivious to the resident mallards...

Figure 9: Heron near The Weir Garden (28/1/23)

... and this robin chirping away:

Figure 10: Robin at The Weir Garden (28/1/23)

Near the entrance is a small bird hide where the volunteers put out food for the local bird population ...

Figure 11: Great, Blue and Coal Tits feeding at The Weir Garden (28/1/23)

Figure 12: From top to bottom - Great Tit, Blue Tit and Coal Tit at The Weir Garden (28/1/23)

Along with the Long-Tailed Tit, these three are the commonest and most widely distributed in the UK. The Crested, Willow and Marsh Tits are much less common - though we have seen a Marsh Tit at Bodenham Lake, a local nature reserve.

We finished off the visit with a trip to a newly-opened tea shop a couple of minutes down the road away from Hereford. The tea shop is so new I cannot find any reference to it on the internet! It has taken over the premises that used to be Lord Nelson Antiques and is adjacent to the Bridge Sollars Garage. It was obviously very convenient for The Weir Garden (no refreshments available) and the food/service was impeccable. We paid just over £11 for pot of tea, a freshly-brewed coffee and two pieces of cake. I'll put a link in when I find one!

A Chill Wind is an Ill Wind - Part 1

"If the world seems cold to you, kindle fires to warm it"    Lucy Larcom

Alternatively, try draughtproofing! This post describes a small draughtproofing project I undertook in 2021 and 2022.

Our front door, sited at the bottom of a stairwell, faces north and is, at times, the coldest part of the house (Figure 1). There is a cellar below, where the temperatures varies from about 8 ℃ in winter to 14 ℃ in summer.  There is no heating in the stairwell and it is the main entrance so lets in the cold winter air when visitors call. The outside wall surrounding the door is of single brick construction typically found in Victorian properties. The house was built in the 1850s and so does not have a damp-proof course to prevent rising damp (not this one but this one). The surveyor's report did not indicate a problem with rising damp but the inside walls were cold enough to cause condensation and allow mould to grow, especially near ground level. This problem was dealt with using a thermal liner, kindly donated by one of our neighbours, that was overpainted.

Figure 1: The Cold Stairwell (January 2022)

The door is modern and made of uPVC solid composite while the transom window is double-glazed (Figure 2); both were installed in 2008.

The sash windows are modern uPVC double-glazed equivalents installed in 2002.

Figure 2: Front door leading to stairwell

The denser cold air settles at the bottom of the stairs and spreads into the adjoining reading/music room, via the door to the right (Figure 1). The rooms left and right of the front door (Figure 2) were cool in summer (great during the hottest weather) and just about OK in winter with the gas fires on provided you did not want to just sit around!

There was an improvement (in terms of warmer rooms/lower fuel bills) when internal cladding, including 50 mm thermal insulation, was added to the external walls of both rooms in 2013. There was insufficient space in the stairwell to do this. When the Air Source Heat Pumps (ASHPs) were installed in 2020, both gas fires were decommissioned and replaced with radiators.

Figures 3 and 4 are infrared photos (FLIR One Pro) taken in April 2021. The outside temperature was 1 ℃ and it is clear where the cold spots are: around the door edges, the handle/lock, and the doorstep. The solid stone doorstep (painted red outside, see Figure 2) provides a direct conduit for transferring heat/cold from inside/outside and is a major contributor to the coldness of the stairwell.

Figure 3: InfraRed Image/Photo (7/4/21)

Figure 4: InfraRed Image/Photo (7/4/21)


In Part 2, I'll describe work done in 2021 to alleviate the coldness.

Getting Ready for the Big Garden Birdwatch

"I would like to paint the way a bird sings"  Claude Monet


This weekend (27 - 29th January 2023) is the RSPB's Big Garden Birdwatch and a chance for everyone to try their hand at a citizen science project. Find a comfortable spot, indoors or out, where you have a good view of your garden or, at least, that part of the garden where the birds usually visit. If you have a birdfeeder then make sure it is topped up (it is a good idea to put the food out a few days beforehand so the birds are aware of it if you are not a regular feeder). Make a mug of your favourite beverage and, perhaps, a few treats. as you will be observing for one hour. Keep a bird identification guide handy for common and rarer visitors.

Although not essential, birdwatching/identification is easier and more satisfying with a set of binoculars.

Figure 1: Hers and His

Unless you have a very large garden, a cheap set of bins is good enough but you can still take part even without these. Keep your phone or camera handy; even a blurred photo may help with identification and you might just snap the picture that wins the Wildlife Photographer of the Year prize.

We have a small trail camera for observing wildlife, mainly birds, in the garden. Today, I made sure it had fresh batteries and was located near to the birdfeeder.

Figure 2: Trail Cam and Birdfeeder

Here's hoping for some decent close-up shots.

Figure 3: View from the Trail Cam

In the background of Figure 2, you might just spot our CCTV camera. This will be trained on the cherry tree and birdfeeder for some wider-angled shots.

Let's hope for good weather and for the local cats to stay away. We will probably do a couple of one-hour sessions - morning and afternoon.

The Cost of Food and the Benefit of a Kitchen Garden

 "One should eat to live, not live to eatMoliere

"If more of us valued food and cheer and song above hoarded gold, it would be a merrier world" JRR Tolkien

I may be stepping out on a limb here, but I think most people consider food shopping a distress purchase in much the same way as refuelling your car and paying the energy bill. Cooking is a more enjoyable task though I would still say it is a chore most would happily pass on to someone else. Eating is, of course, essential but, I would hazard, Moliere probably sums up the majority of peoples' thoughts including ours'. We do still enjoy eating out in the knowledge that someone else has slaved over a hot stove to produce a sumptuous repast and we do not have to clear up the mess afterwards. Most of the time, though, we are just as happy eating in or picnicking out.

Our goldfish, on the other hand, always eats in and he gobbles the food so fast it is difficult to believe he even tastes it let alone enjoys it ...

A recent survey (pre-COVID) found that UK adults eat out on 2.4 billion occasions per year. Since there are approximately 40 million UK adults, that works out to 60 meals per adult per year on average. Assuming each adult eats about 1000 meals per year (three meals a day), that still means 94% of meals are still eaten at home (or someone else's home if you're lucky enough to be invited round!).

Since we consider food shopping to be a distress purchase, we've never paid much (any?) attention to how much it cost us. We just grew what we could, bought what was necessary, and minimised any waste. If I had to guess a figure, then it would be around £100 per week for the two of us. 

Why would I like to know how much our food bill is? One major and one minor reason. The major reason relates to 'growing your own' and answering the question - does it save money? For this, I need a time series of regular food bills. The minor reason is just for general use - such as completing a carbon footprint questionnaire - for which I only need the cost of a typical weekly food shop.

An opportunity to come up with a more realistic estimate presented itself when the UK went into COVID-19 lockdown in March 2020. From that moment, we switched to home deliveries from a single supermarket - and because we had to register with the supermarket, they kept a tally of everything we spent. We still have the bulk of our groceries delivered - a cheap (£1) & eco-friendly option - though we are also shopping at local shops (on foot). According to How Bad Are Bananas, a supermarket delivery is between two and six times (diesel van vs electric van) less carbon intensive than driving yourself.

Our first delivery was on the 9th of April 2020; we had tried to get an earlier slot but, in the general rush from every other UK household, we had to wait our turn. It was quite a large delivery as we had run out of quite a few basics - some basics such as flour, pasta, and toilet rolls were in short supply at the time due to panic-buying. The value of all deliveries from 9/4/20 to 21/1/23 are plotted out in Figure 1.

Figure 1: Supermarket Food Bills

Christmas food bills are often higher as households prepare for family visits. Xmas 2020 was cancelled, due to a more virulent COVID variant arriving in the UK. Christmas 2021 (big shop marked .) did take place although only one of two sets of visitors arrived (COVID again). Most of the shopping for Christmas 2022 was done in person 

If I sum up the total for the whole period (£7280), divide by the number of weeks (147), then the average weekly spend for the two of us would be about £50 (i.e. £25 per person). There are a few caveats, however:

  • Firstly it does not include my bottles of wine which I buy through mail order from Laithwaites
  • Second, it does not include any cleaning materials whether for humans, laundry, kitchenware, toilets or general cleaning; these are also bought via mail order from BigGreenSmile
  • Third, it does not include toilet paper, kitchen towels, and paper tissues shipped in from Who Gives a Crap
  • Fourth, it does not include tea and coffee bought on-line from specialised retailers
  • Fifth, certain items such as bread flour, vegetable stock powder, and cashew nuts are bought on-line
  • It does not take into account inflation which was low at the start of the pandemic but rose rapidly for a number of reasons including Putin's illegal and cruel invasion of Ukraine. Food inflation was 16.8% in December 2022 in the UK
  • It does not take into account the greater use of other shops locally after June 2021 when the vaccine became widely available
Visual inspection of Figure 1 shows food bills are lower in the main harvesting months (June - November) than is Winter-Spring months (December - May) where the growing season is largely dormant (with some notable exceptions, of course, like winter greens/brassicas).

To be honest, the cost data are neither extensive enough nor sufficiently detailed for a robust analysis. Food bill costs from June 2020 to May 2021 covers a single year and is, undoubtedly, the most robust data set because it covers: (i) one harvest season (June - November 2020) and one dormant season (December - May 2021), and (ii) there was limited access to alternative shopping venues during this period.

For the 6-month harvest season (June - November 2020), the supermarket food bills totalled £1206. For the following 6-month dormant season (December - May 2021), the supermarket food bills totalled £1633. A difference of £427 and a 'profit' of £250 after an allowance of £177 for seeds, fertiliser, seed compost, organic pest control, etc.

The real profit will be much higher because even in the dormant season (December - May) we are still eating stored produce (e.g. potatoes, onions, pears), frozen/preserved produce (currants, raspberries, apples, chilli and sweet peppers, aubergines, tomatoes, cucumbers, French beans, sweetcorn) and still harvesting fresh winter greens, celeriac, chard and parsnips. These produce will have reduced the supermarket food bills significantly in the 'dormant' months. I don't think it is unreasonable to consider a 'profit' of £500 from our 10 x 10 metre Kitchen Garden. Plus the added benefit of fresh, pestide-free vegetables and fruit.


Hot Composting #4

If you are thinking of going down the hot composting route then one of the first questions you will want to ask yourself is: what size of hot compost bin will I need?


HOTBINs come in 3 sizes: 100, 200 and 450 litres. The Green Johanna is available in only one size (330 litres) whilst the Aerobin comes in a 200- and 400-litre formats. Other hot composters may be available.

I have three 200-litre hot composters - 1 x HOTBIN and 2 x Super Compost Bins*

[* prototype from SoilFixer - Disclaimer: I received the first one gratis for trialling/reviewing and bought the second one. The prototype is now available as the HOTBIN Mega]

Figure 1: My HOTBIN

Figure 2: One of my Super Compost Bins ready for emptying

Modes of Operation for Hot Composting

Generally, there are two basic ways to operate your hot composting bin and this will impact the amount of garden waste that can be processed:

Mode A: Fill the bin with garden waste and ignore for 30 days once you are happy that the operating temperature (60 ℃) has been reached during the initial stages. If your garden waste comes in bulk at certain times of the year then this method involves minimum effort. However, it is not the most efficient way of processing large quantities of organic garden waste unless you have lots of hot composting bins (expensive!). And you will end up with a less than half-full bin of composted matter to spread onto the garden.

With a slight modification, this procedure can be improved upon. Start by filling the bin about two-thirds full with mix of green and brown garden waste and continue to add more daily to rapidly fill the bin. It usually takes a couple of days to reach optimum temperatures (50 to 65 ℃) during these early stages. As the compost breaks down and reduces in volume, continue to add more compost up to about the twentieth day (the time varies from one compost run to another). As soon as the active compost temperature at the top of the bin drops to 50 ℃ or below, stop adding organic waste and leave the bin contents to mature for at least 2-3 months. Compost yield was about 120 litres.

Figure 3

An example of this modified approach using one of my Super Compost Bins is illustrated in Figure 3. Although nominally a 200-litre bin, the internal dimensions are approximately 180 litres. The bin was filled over the first two days and checked to ensure it reached 'operating' temperatures; compost temperatures were measured with probe thermometers at three depths: 50 cm, 30 cm and 10 cm. After a short holiday break, I returned on Day 5 to find everything hunky dory and all bin temperatures within the 'Goldilocks' range (40 -60 ℃). Further garden waste was added daily up to Day 21, then stopped once the temperature in the upper (i.e. most active) part of the compost heap (Temp@10cm) dropped below 50 ℃. The compost bin was left to mature without any more additions; it is currently at Day 80 and will probably continue its maturation process for at least another 6 months.

As Figure 3 shows, the modified Mode A method was able to process 400 litres of garden waste or twice as much as the 'standard' Mode A procedure. It is worth noting here that I shred my garden waste, which effectively reduces its volume by about 50%; all volumes reported here are shredded waste volumes. If you add your garden waste 'as it comes' then you will not be able to process as much; however, if you cut up your garden waste into one-inch (2.5 cm) pieces then you should achieve similar volume reductions in the composting process.

Mode B: By taking a more leisurely route to filling your hot composting bin, you will be able to process even greater quantities of garden waste. And, consequently, you'll need fewer hot composting bins.

Start the new hot composting process by approximately half-filling the bin with your mix of green and brown vegetation. The contents should heat up to 40 - 60 ℃ in a day or so. Continue to add small amounts daily (2 - 10 litres) or when compostable material becomes available. This method is ideal if your garden/kitchen waste comes in small batches. You can start the process with as little as one-third of a bin provided you are using an efficient hot composter such as the HotBin. An advantage of this method is that it gives you more control over the initial start-up to ensure hot composting temperatures (40 - 60 ℃) are reached asap. Should anything go wrong (and no process is perfect), it is easier to clear out a half-full bin than a full one. An example of a Mode B run is illustrated in Figure 4.

Figure 4

Over 1000 litres of shredded garden waste was processed in this particular compost run (Figure 4) with approximately 250 litres of finished compost produced. You will have noticed, I'm sure, that the lengths of these two composting processes (Figures 3 and 4) appear very different. In practice, they were not too dissimilar: 80+ days (modified Mode A, Figure 3) compared with 145 days (Mode B, Figure 4) and double the yield of finished compost in the Mode B process. Furthermore, you would need at least two hot composters to operate in a continuous manner with Mode A. As another example, my current HotBin has been running continuously for 443 days; I will report on that once it has finished.

So there are two basic methods: (i) fill as fast as you can, or (ii) fill regularly and slowly. In fact, there is a third way which is to use a hybrid of both methods and adapt according to the seasons and availability of garden waste. I use the hybrid method, but erring more toward Mode B, because that fits in best with my accessibility to garden waste.

As a general rule, I start a bin by filling between one-third and one-half full with a 50:50 (approx) mix of green and browns. The bin reaches its operating temperature (40 - 60 ℃) within 24-48 hours after which I will add 6 - 10 litres per day on average. I am in the garden doing jobs most days so this routine is convenient for me. I keep an 80-litre bin filled with shredded garden waste close to the hot bins for these daily top-ups. If I have a large amount of garden waste to compost then I will add greater quantities or fill the bin - I will often do this if we are going away for a week. I monitor the temperatures during the hot composting process at depths of 50 cm, 30 cm and 10 cm so I can check the hot composting process is proceeding satisfactorily and identify any problems early.

When considering how many hot composters we require, these are the things we need to think about:

  • how much garden waste do we want to compost?
  • which hot composting method are we going to use?
  • do we want to compost all year round or just in the warmer high-growth months?
  • do we have an area/space where we can finish the composting process outside of a hot composting bin?
Let's start by working out how much compostable matter we will produce by looking at the example of our garden.

Estimating the Number of Hot Composters Needed from the Size of your Garden

I operate 3 x 200L hot composters: two or three of them will be in action during summer and autumn when vegetative growth is fastest but only one will be kept operational during winter. Apart from my own garden waste, I collect and process material from four neighbours.

  1. Our rear garden is just under a tenth of an acre (370 ㎡) of which about half comprises hard surfaces (patio, paths, sheds, greenhouse). So just under 200 ㎡ for growing flowers, trees, bushes, vegetables and fruit. There is no lawn. On its own, the garden would provide sufficient garden waste for between one and two 200-litre hot composting bins.
  2. My next-door neighbour has a small lawn (25 ㎡) and donates all their grass mowings plus a few clippings, mainly the overhangs of the hedge, clematis and jasmine that border both properties.
  3. My other next-door neighbour donates about 300 litres of garden waste per annum (mainly dried palm leaves and cherry tree prunings).
  4. Our neighbours/friends across the road supply about 1500 litres of, mainly, conifer and holly hedge cuttings once a year.

Hedge trimmings from a neighbour
    5. Our next-but-one neighbour had a garden of similar size to ours (200 ㎡) but mainly laid to lawn with a number of mature trees, including several old apple trees, plus some flower borders and a large pond. I did not get the lawn cuttings but did get all the other prunings, fallen apples and garden waste. They recently moved into a new house with a much smaller garden (~75 ㎡) a few miles away so I no longer get the garden waste from the larger garden. However, they still bring me their garden waste in addition to a monthly 60-litre bag of spent church flowers. Strangely, I now receive the lawn clippings although they are usually yellowing and part-composted and matted by the time I get them.

In summary, my three hot compost bins (total nominal volume = 600 litres) were in constant use and worked hard processing garden waste from just over a fifth of an acre. Since our neighbour's move, we only receive garden waste from between 0.1 to 0.125 acres and my three bins are not worked as hard. Indeed,  I could probably get by with just two bins.

Estimating the Number of Hot Composters Needed from the Volume of Garden Waste

Garden waste, as received, is often bulky (e.g. whole plants including roots, hedge cuttings, fruit tree prunings). Ideally this needs to be chopped or shredded to increase the ease and speed of the composting process.

Apart from grass mowings and kitchen waste, pretty much everything else will go through my shredder to reduce the bulk by about 50%. [note: shredding efficiency depends on the sharpness of the rotating blades  in my Bosch Shredder and I'll admit to not changing the blades often enough].

Shredded hedge trimmings

Shredded material is stored in an 80L bin sited near the hot composters ...
 
80L Bins for Garden Waste

If you have a good feel for the quantities of garden and kitchen waste you produce each week, month or year then you can have a pretty good guess at how many hot composting bins you need. As discussed earlier in this post, a single HotBin can handle up to 2000 litres of chopped or shredded garden waste  even if you defer from composting over winter. Since 2000 litres of shredded compost equates to about 4000 litres of 'raw' garden waste (hedge trimmings, hard- & softwood prunings, old bedding plants, fallen leaves, deadheaded flowers, etc), it means a single HotBin can process 50 x 80L standard plastic dustbins or 6/7 one-tonne bulk carriers of raw garden waste per year. On a somewhat more human-scale, a single 200L HotBin needs, on average, a minimum of 2 litres of chopped kitchen/garden waste per day and can comfortably handle up to 10 litres per day.

Summary

A 200-litre Hotbin is sufficient for processing between 15 and 70 litres per week of chopped kitchen and garden waste. In terms of garden size (i.e. the area vegetatively planted and excluding hard surfaces), I estimate something of the order of 100 square metres (10 m x 10 m) or, in old money, 1000 square feet (30 ft x 35 ft) could be handled by a single HotBin (200 L). Smaller and larger Hotbins are available should you need to scale up or down.

This has been a rather rambling post. I started it some time ago. It was meant to be short but just grew and grew. If anything is not clear, please get in touch. Hopefully, it contains some useful information. 


Electricity Generation - Are Wind and Solar Cheaper than Fossil Fuels?


I am going to let someone else (Rosie Barnes), far more qualified than me, answer this question by pointing you toward two recent videos she put out on her YouTube channel (Engineering with Rosie). In the first video, Rosie compares the cost of electricity produced by coal, gas, solar and wind. Best to watch this one first ...

... because the second video repeats the analysis but adds another two energy sources (nuclear and geothermal) to the mix ...


This type of comparison is not easy because there are so many unknowns and additional factors that need to be taken into account: such as the extra cost of energy storage for intermittent renewables, transmission losses, subsidies, pollution, etc. Some of these 'elephants in the room' are discussed.

For those of the tl:dw inclination, the titular question is answered in the affirmative. And if you think we should just build lots of nuclear power stations, I hope you have very deep pockets.

Occasionally, I have flights of fancy and imagine I am the Prime Minister of the United Kingdom. What policies would I enact? Well, as part of a 10-year energy plan, I would:

  1. Immediately legislate for all new homes to be insulated to at least Passivhaus standards, fitted with ASHPs and a minimum of 2.5 kW PV panels.
  2. Over the full 10-year period, insulate existing homes upto at least EPC rating C (though B would be better)
  3. Over the full 10-year period, install, free of charge, 2 kW PV systems on all suitable residential roofs. Residents could pay for additional generation and/or battery (thereby, saving on some installation and hardware costs). The aim is to add up to 5 GW per year (currently 0.73 GW per year) to the existing 15 GW at an estimated cost of £2.5 billion/year (assuming significant cost savings on PV panels and installation at this scale). It would be a far better use of our money than the current Government's Levelling Up agenda with the added benefits of extra jobs, increased tax income, upskilling the workforce, improved energy security, and lower energy bills. We would also achieve our net-zero climate target well before 2050. The existing Feed-in Tariff (FIT) would not apply to new installations (it was a stupid idea in the first place even though we personally benefit).
  4. Offer tax breaks and incentives for PV installations on non-residential premises.
  5. Increase HMG's R&D budget for renewable energy and storage technologies (£500 million?). Why do we not have any significant energy contributions from wave and tidal technologies? 

There are, of course, other areas of Government policy that I may comment on at another time.


First Garden Snowdrop of 2023

 
Mary saw the first tight snowdrop bud around the 4th of January but this is the first photographic evidence of an open flower on 14th. The flower probably opened some days earlier but we just didn't notice.

First Snowdrop in the Garden (2023)

Last year's first snowdrop (2022) opened around the same time as this year's (2023) and a couple of weeks earlier than 2021. Last year (2022) was warm overall although December was cold. As far as I'm aware, our winter-flowering snowdrops are perfectly happy with cold weather - it is warm weather they don't like.

I have added this record to the Nature's Calendar database operated by The Woodland Trust. Another example of citizen science!

Dark Skies


Google reminded me of this photo taken 9 years ago. Not 100% sure where it was taken but bearing in mind it was the middle of January (i.e. winter), I suspect it was the Isle of Wight where Mary's parents lived.

The photo also reminded me that CPRE has been sending out reminders for Star Count 2023. This will take place between the 17th - 24th February. This an excellent opportunity to be part of a citizen science project. It is the same experiment as last year: just step outside your front or back door, find Orion (The Hunter) in the night sky and count the number of stars you can see within Orion. If you sign up you will get more information and reminders. Remember, even if you are not at home you can still participate - indeed it is advantageous to have reports from as many locations as possible to build up a better picture of skyglow in the night sky.

Light pollution has been steadily getting worse and is obliterating our view of the wonderful night sky.

Sourced from BBC and Kyba et al

Kyba et al have a very readable paper published in Science that is summarised nicely on the BBC website. The paper collates international citizen science data from Globe at Night, using the same approach as CPRE's Dark Skies but is more comprehensive. Why not join this citizen science project as well!

You should also read this commentary by Falchi and Bara, which puts the paper by Kyba et al into context. While light pollution is an annoyance for those just looking up at the beauty of the night sky, it is detrimental to the study of astronomy and potentially life-threatening to many species we share this precious earth with, e.g. moths.

Kyba et al report an annual increase in the light pollution of 7-10% over the last 11 years (i.e. a doubling of skyglow every 8 years). A major reason is, of course, the large amounts of artificial light we humans generate, specifically in urban environments.

NASA photo

Many communities are switching to LED lights because of their lower energy consumption - a benefit to your purse/wallet and the global climate. If we thought this might reduce skyglow then we appear to be mistaken. This could be an example of rebound effect. Because LEDs are less energy intensive and cheaper to run, we use them more widely so the overall reduction in energy use is less than predicted from simply assuming a switch from old technology to new technology.

Laundry Day - Which is Better? Wind or Sun?

I am approaching this interesting question from an energy-efficiency and carbon-intensity viewpoint. Firstly, some basic considerations on how to minimise running costs and environmental impact:

  • Step 1: Make sure your appliances are as environmentally friendly as possible. We have a LG A+++ washing machine (6½ years old)  and a Beko Heat Pump A++ tumbler dryer (5½ years old). They've been trouble-free but we would look to repair them should anything go wrong. Because most of your carbon footprint per wash is embodied emissions in the manufacture of white goods, it is always best to keep your appliances for as long as possible, even if it is less efficient.
  • Step 2: Run as low a temperature wash as you can; 30 ℃ washes are de rigeur in this household but see Step 5.
  • Step 3: Use a washing line to dry your laundry whenever possible. When we use the condensing tumble dryer, we collect the 'distilled water' - conductivity 10-20 microsiemens - and re-use for watering plants, rinsing out test vials used for river testing and topping up the Campervan's windscreen washer bottles. Laundry items, particularly towels, can be a little rough and scratchy when air-dried on a washing line especially on a hot sunny day. You can either let them soften with use (my preferred option), use fabric conditioner/softener (see Step 4), or give the air-dried clothes a few minutes in the tumble dryer.

  • Step 4: Use environmentally-friendly washing products wherever possible. Often this means avoiding detergents and soaps that contain phosphates. Rivers passing through urban settlements often see a spike in phosphate levels due, in part, to detergent use by the local population. We source our cleaning products from BigGreenSmile but there are plenty of other options. The use of fabric softeners/conditioners seems to be a little controversial with both pros and cons (see Step 3)
  • Step 5: Launder as infrequently as possible. As a general rule, clothes worn next to the skin are worn once before washing while outer garments can be worn many times before washing. For us, a light and dark wash at 30 ℃ every week suits our needs. There are varying opinions on how often to launder bedding and towels; we opt for weekly on a 40 ℃ wash cycle.

There are two primary reasons why I choose to do the laundry on a sunny day. Firstly, the running costs are nil (or virtually nil) and the electricity used is zero carbon-rated because it is generated from my rooftop photovoltaic (PV) panels. There is a third reason; it is easier to dry the washing outdoors on a  sunny day, ideally with a gentle breeze. In late Spring, Summer and early Autumn, it is usually possible to wait for the right sort of day and I'm more than happy to procrastinate if tomorrow's weather forecast is more promising.

To give some idea of how carbon-intensive washing your stuff can be, I consulted to my copy of How Bad Are Bananas by Mike Berners-Lee plus some manufacturer's specifications. I have excluded the embodied emissions from the manufacture of the appliances (about 270 g CO2e per wash per appliance), as we cannot do anything about them and they are the same for everyone.  Estimated carbon footprints for a full wash load are:

0g CO2e if washed at 30 ℃ & dried on a washing line on a sunny day (thanks to our PV panels)

60g CO2e if washed at 30 ℃ & dried on a washing line using typical UK grid electricity

0g CO2e if washed at 60 ℃ & dried on a washing line on a sunny day (thanks to our PV panels)

320 g CO2e if washed at 60 ℃ & dried on a washing line using typical UK grid electricity

0g CO2e if washed at 30 ℃ & dried in heat pump tumble dryer on a sunny day (thanks to our PV panels)

1kg CO2e if washed at 40 ℃ & dried in heat pump dryer using typical UK grid electricity

Note 1: For my calculations, a carbon footprint is 0g CO2e means the financial cost is also zero. 

Note 2: from April to September, the output from my PV panels on a sunny day is sufficient to run either the washing machine or the heat pump drier as well all the other household equipment working in the background. Best not to switch the oven on at the same time, though.

On a sunny day in early January, PV output is typically about 1.5 kWh. About 0.5 kWh is background electricity use, leaving only 1 kWh for washing and drying. Apart from the heating stage, this is sufficient for the washing stage; even if it is sunny and cold then you can still air dry outside to remove most of the water before finishing off in the tumble dryer or using an indoor clothes airer.

Note 3: These carbon footprints will reduce as the % renewables that make up the Grid increase. How Bad Are Bananas used a carbon impact of 340 g CO2e for each kWh generated for the UK Grid. That was over two years ago. Emissions data from NationalGrid:Live indicates this figure has already dropped to around 200 g CO2.

Taken from NationalGrid:Live and National Grid ESO

So, we have established that doing the laundry on a sunny day is best in terms of cost and carbon impact. But, what if the day is not sunny? Do we have any options other than to 'bite the bullet' and carry on regardless?

It was this question that first entered my consciousness on the final day of October, last year (2022). I was contemplating 'putting a wash on' but the weather that October day was not a good day for laundering. It was cloudy with the promise of drizzle all day, and the weather forecast for the following day was no better! If we were going to make that day a wash day then it would not be a zero-cost, zero-carbon wash. Clearly, I could do nothing about the cost but maybe I could keep my carbon footprint as light as possible by choosing a time of day when renewable (wind, solar, hydroelectric) and low-carbon (nuclear, pumped hydro, biomass) energy sources were in the ascendency for the UK Grid.

Time to refer to a couple of excellent websites giving current information on how the electricity is being generated in the UK. Gridwatch has been going for a good many years ...

Screenshot from Gridwatch.co.uk

while National Grid: Live run by Kate Morley is a more recent, but very welcome, addition. Having started out with the former, I now tend to use the latter because I prefer its layout especially on mobile devices.

Screenshot (15/1/23) from NationalGrid:Live

Both websites give current and historical data on generation source, levels, costs, emissions, etc.

Anyway, back to the laundry which wasn't going to wash itself. Having checked National Grid:Live beforehand, I delayed putting the laundry wash on until 10.43 pm when generation sources for the UK Grid comprised renewables (53.0%), low-carbon (22.6%), Imports (2.7%, mainly hydro from Norway and nuclear from France if I remember correctly) and Fossil Fuels (21.7%).

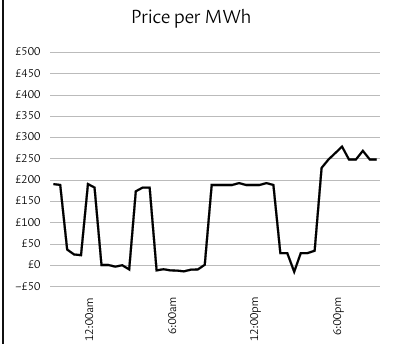
From a carbon footprint point of view, it is often better to use electricity overnight when demand is lowest and the 'renewables' element is a higher proportion of the overall electricity generation. If you can access a variable tariff, you may also find it is cheaper overnight. The screenshot below from NationalGrid:Live shows the price per MWh was actually negative between 0130 - 0230 and 0430 - 0730.
 

Screenshot from grid.iamkate.com (2130 hours, 15/1/23)


At some time in the not-too-distant future, flexible tariffs will become widely available (smart meter required) that will pay you to use electricity at certain times of the day or night when supply outstrips demand. On the downside, you will be charged more for using electricity at peak demand times so you may need to become more organised if you want to save/make some money.

Variable demand (black line) over 24 hours (15/1/23) from NationalGrid.Live

For electricity generation to have a significant renewable content at night, the wind does have to blow cos the sun don't shine. So, sometimes sun is best for Laundry Day but wind can also be best.

The ideas posited in this post also apply equally well to dishwashing.

At some point in the not-too-distant future, I'm sure humanity will finally accept it has to wean itself off the finite resource that is fossil fuels. The recent increase in the cost of gas - primarily down to that bully-in-chief, Putin - has brought some politicians to their senses a little quicker than expected. I am now expecting to see a big increase in renewable energy investment and R&D in the coming years. We can all help by economising on our energy usage wherever possible and helping that shift to renewables.


Heating Degree Days

In the previous post, I mentioned that one of the data outputs from the Weather Station is the Heating Degree Day (HDD). The relationship between mean daily temperatures and daily HDD is illustrated in the plot below for our Hereford-based weather station covering all 12 months of 2022.

Figure 1: Mean Outside Temperature/HDD for Jan - Dec 2022

In principle, HDDs can be used to estimate the daily heat energy demand for a building by taking into account the daily outside temperatures. Depending on geographical location, there is an agreed base temperature where the building's heating comes on if the outside temperature drops below this base. For example, in the USA the base temperature is 65 ℉ (18.3 ℃) whereas in the United Kingdom (UK) it is 15.5 ℃ (60 ℉). The Swiss are clearly hardened against the cold as their base temperature is only 12 ℃!!

On a daily basis, you calculate the HDD by subtracting the average outside temperature from the base temperature:

Average (Mean) Temperature = (Tmax + Tmin)/2

HDD = Base Temperature - Average Temperature

If the mean outside temperature is above the base temperature then HDD is always 0 (zero). If the daily mean outside temperature is, say, 10 ℃ (50 ℉) when the base temperature is 15.5 ℃ (60 ℉) then the HDD value for that particular day will be 5.5 HDDs [in units of ℃ HDDs]. However, because our American friends still like to work with the Fahrenheit scale, they will record this as 10 HDDs except, of course, they use a 65 ℉ base temperature so will, in fact, report a value of 15 HDDs [in units of ℉ HDDs]. If you are still having trouble, consult the Wiki page!

One advantage of my Davis system is that HDD is calculated every 15 minutes for a much more accurate HDD value compared with the use of just daily maximum and minimum temperatures as above. The Davis system allows you to select how often but every 15 - 30 minutes is a good compromise. For example, the minimum and maximum daily temperatures were 0 ℃ and 13 ℃ respectively on January 3rd 2023 which calculates to a HDD of 11.8 (18.3 ℃ minus 6.5 ℃). On the other hand, when calculating the HDD using fifteen minutes packets throughout the day, the HDD value is 9.8. The difference is not always this great but the more accurate method does seem to give lower HDD results so could be significant over the whole year.

From the prior discussion, it follows we would expect HDDs to correlate with the energy used (kWh) to heat a building. Our detached house is split into the Main House and the Annexe, each with its own Air Source Heat Pump (ASHP). The plot below shows the monthly energy use for each ASHP - along with the combined total - for 2022.

Figure 2: Energy Consumption (kWh) for ASHPs

Note the similarly shaped plots in Figures 1 & 2 for HDDs and heating energy used. We would therefore expect a good correlation between HDDs and the energy used by the ASHPs to keep the house warm. Fortunately, the ASHPs have their own monitoring system so we can isolate electricity used for heating from the other uses of electricity (such as writing this blogpost!). Both ASHP systems have solar water heating and provide all space and water heating requirements. In the data analysis that follows, I use the total energy consumed by the ASHPs for both space and water heating. [Note: for 2022, the electrical energy (kWh) use for water heating was between 16% and 17% of total energy use for both ASHPs].

The relationship between ASHP energy use (kWh) and HDDs is plotted below for each individual ASHP and the Combined Total (Main House + Annexe). The best fit of the data for all three datasets, based on the correlation coefficient (R²), was a polynomial (n=2).

Correlation of ASHP Energy Use vs Heating Degree Days (℃)

For brevity, let's just consider the data for the combined total energy use (Main House + Annexe). The following three plots show relationships for linear, exponential and polynomial (n=2) fits ...


All three curves show a good to excellent fit but the polynomial fit is superior. It would be surprising to see a linear fit since the efficiency of the ASHPs (Coefficient of Performance, COP) varies with outside temperature and not in a linear way. And while an exponential fit would be cool and sound more 'scientific', it comes as no surprise to find the polynomial is best.

As a check on the validity of the polynomial fit, I collected the HDD monthly data for 2021 and used it to calculate the ASHP energy use for that year. I could then compare the calculated value with the actual measured value:

Calculated ASHP energy use (2021) = 6740 kWh
Measured ASHP energy use (2021)  = 6841 kWh

[note: the ASHPs were installed in 2020 so I do not have a complete set of monthly/annual data for that year]

The agreement between actual and calculated is probably better than I expected. It is important to remember that the derived polynomial equation is specific to our house and our method of heating.

 Finally, let's see how electricity use for heating (space and water) compares over the (nearly) three years we have been using ASHPs.

2020: 6074 kWh (estimated from HDDs)
2021: 6841 kWh (measured)
2022: 6254 kWh (measured)

2021 was the coldest of the three years in Hereford by a significant amount with a mean annual temperature of 11.2 ℃.  Understandably, energy use for heating was the highest in that year.

2020 and 2022 were both equally warm years in Hereford with annual mean temperatures of 11.8 ℃; therefore, energy use was similar in these two years.
  • The small increase in energy use in 2022 over 2020 may be explained by a change in the heating programme used in both the main house and the annexe.
  • In 2020, the daytime thermostat (0600 to 2200) was set to 18 ℃ and reduced to 16 ℃ overnight (2200 to 0600) in the main house; indoor temperatures were boosted to 20 ℃ on cold days between 0800 and 2200 hours.
  • In 2020, the Annexe thermostat was set at 16 ℃ and re-programmed to higher temperatures (18 ℃ to 20 ℃) only when we had guests staying 
  • For 2022, a base temperature of 18 ℃ was set for the whole 24 hours in both the Main House and the Annexe. The Main house was boosted (0900 to 2200 hours) to 20 ℃ during the colder months while the Annexe was only boosted (18 ℃ to 20 ℃) when guests stayed.
  • There was only a minor increase in energy use (~3%) when maintaining a constant 24-hour background temperature of 18 ℃ instead of 16 ℃ in both the Main House and the Annexe. Possibly because the ASHP works more efficiently when (i) trying to maintain a constant 24-hour temperature, and (ii) when boosting from 18 ℃ to 20 ℃ instead of 16 ℃ to 20 ℃. Simple is often best - just ask Occam.
  • I should also mention that our woodburner stove was used more frequently in 2020 to provide extra thermal input. In 2022, it has only been lit twice so far this winter because it has not been required due to the higher baseline thermostat settings.

Popular Posts

Blog Archive