View from the Rear Window - December 2023

 "December, being the last month of the year, cannot help but make us think of what is to come" - Fennel Hudson

The cold weather that ended November 2023 continued into December for a few days (Photo 1) before slowly warming up. The second half of the month was warm for this time of the year (Photo 2) though glimpses of sunshine were at a premium. Rain was certainly not in short supply and fell, mainly, at the start and end of the month. The winter flowering cherry added some welcome glamour to the garden scene.

Photo 1: A cold frosty morning (2nd December 2023)

Photo 2: Boxing Day 2023

A quick overview of the garden in December can be seen in the time lapse video (Video 1) below:

Video 1: Daily Garden Photos (December 2023)

While preparing the time lapse video, Clipchamp gave an option to produce an AI-generated video. Provided with the same daily photos, Video 2 was the end result. Better production values for sure but not as informative in my opinion.

Video 2: AI-generated Video of Daily Garden Photos

Summary of Weather Parameters for December 2023

Overall, a warm, cloudy and wet month with some sharp frosts at the beginning. Quite windy with a top speed of 61 km/h on the 28th December during Storm Gerrit.

Table 1: Weather Stats for December 2023

December 2023

Weather Parameter

Value

Dates

Average Monthly Temperature 

5 oC


Maximum Monthly Temperature

15 oC

23rd

Minimum Monthly Temperature

-7 oC

18th

Number of Air Frost Days

6


Number of Hot Days (> 25 oC)

0


Monthly Precipitation

75.0 mm


Greatest 24 h Precipitation

17.6 mm

3rd - 4th

Number of Dry Days

10


Monthly Sunshine Hours (estimated)

39


Average Wind Speed

5 km/h


Highest Wind Speed

61 km/h

28th

Maximum Barometric Pressure (Sea Level)

1039.6 hPa

21st

Minimum Barometric Pressure (Sea Level)

983.9 hPa

2nd

Average Barometric Pressure (Sea Level)

1010.9 hPa


Heating Degree Days

325.5


Cooling Degree Days

0.0


December's daily minimum & maximum temperatures are plotted out in Figure 1. The first half of the month was cold then cooler; the second half was balmy for December in England (even at night) which was just barmy.

Figure 1: Daily Min/Max Temperatures for December 2023

Daily rainfall and sunshine hours (estimated) for December 2023 are displayed in Figure 2. Most of the rain at the start and finish of the month with limited sunshine due to cloudy skies. On the plus side, the clouds ensured the nights stayed reasonably warm (Figure 1).

Figure 2: Daily Rainfall & Sunshine Data for December 2023

This month, for the first time, we can compare five December months from 2019 to 2023. There are a few trends beginning to show in the temperature data (Figure 3) although it is far too early to be sure without a longer time series. However, there is a discernible upward trend in the maximum December temperatures and a discernible downward trend in the minimum temperatures. Combined these two trends lead to slightly cooler mean (average) monthly temperatures. Significantly colder minimum temperatures have been experienced during the last two Decembers compared with the norm for 2019 - 2021. This may (I repeat may) be due to changes in atmospheric and ocean circulations, brought about by climate change, that result in colder winds from the north rather than warmer winds from the west during the English winter. Of course, it is far too early to tell and much more data are needed. It is worth remembering that climate change is not always intuitive (global warming does not mean everywhere gets warmer). However, there is no need to panic at the moment! Well, not until we get the data from next December!!!

Figure 3: December Temperature Data for the 2019 - 2023 Period

Rain, wind and sunshine data for the past five Decembers are summarised in Figure 4. The amount of rainfall in December is variable, sunshine levels are fairly constant (small decrease?) while maximum wind speeds are on an upward trend (possibly?!). Note that climate change is measured over much longer periods, typically 30 years, so these shorter time series are only indicative of trends that may or may not be sustained in the future. Time will tell!

Figure 4: December Rain/Wind/Sun Data for the 2019 - 2023 Period

The UK Met Office report for December 2023 can be found here. From this report (Figure 5) we learn that December 2023 was warm or very warm for England, Wales and Northern Ireland with Scotland about average. There were some very warm spots in south Herefordshire (Figure 5) though not in Hereford itself.

Figure 5: UK Mean Temperature Anomalies (December 2023)

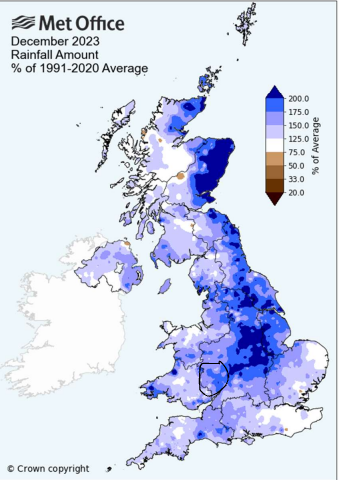
Rainfall distribution for the UK is shown in Figure 6 indicating Herefordshire had higher than normal amounts of rain. The nearby Met Office weather station at Credenhill reports an average (1991 - 2020) rainfall for that location of 72.67 mm; close to the 75 mm reported by my Davis Weather Station (Table 1) for December 2023. Hereford City often reports lower rainfall than the surrounding rural environment - possibly due to its location between the Welsh Hills to the west and The Malverns to the east.

My weather station, located in an urban garden, may also be in a rain shadow surrounded as it is by dense housing. A colleague from the River Wye citizen science project I help out with, consistently measures higher rainfall amounts than my weather station despite living only a kilometre south of me. The Met Office weather station at Ross-on-Wye reported 130.6 mm of rain for December 2023 (against a December average of 80.14 mm).

Figure 6: UK Rainfall (% relative to 1991-2020 mean) - December 2023

The Met Office and I both agree there was a lack of sunshine in December - though I'm not sure the picture was as black as the Met Office (Figure 7) painted it - at least not for Hereford City. Perhaps that rain shadow has a silvery sunny lining!


Figure 7: UK Sunshine (% relative to 1991-2020 mean) - November 2023

Jobs in the Garden
  • Harvesting carrots, beetroot, parsnip, celeriac, cauliflower and red cabbage
  • Using up stored vegetables (tomatoes, garlic, Jalapeno peppers, potatoes, green beans, courgettes, celery, onions) and fruit (raspberries, gooseberries, blackcurrants, redcurrants, pears)
  • Composting jobs - hot composting with a single HotBin throughout winter - layering finished garden compost on fruit trees/bushes and vegetable plots.
Flora & Fauna (seen in the Garden)
  • 4 x Blackbirds
  • 5 x Blue Tits
  • 2 x Collared Doves
  • 1 x Dunnock
  • 1 x Great Tit
  • 10 x House Sparrows
  • 5 x Long-tailed Tits
  • 2 x Magpies
  • 2 x Robins
  • 6 x Starlings
  • 3 x Wood Pigeons

And finally, some December garden photos ...

Photo 3: Frozen Bird Bath (1/12/23) 

Photo 4: Frosted Swiss Chard (2/12/23)

Photo 5: Frosted Spider's Web on Weather Station (2/12/23)

Photo 6: Ice Crystals on Rosehips (2/12/23)

Photo 7: Red Cabbage and Cauliflower (9/12/23)

Photo 8: Last of the Fresh Tomatoes from the 2023 Kitchen Garden (11/12/23)

Photo 9: Winter Solstice 2023 Half Moon from the Garden (Pixel 7 Pro)

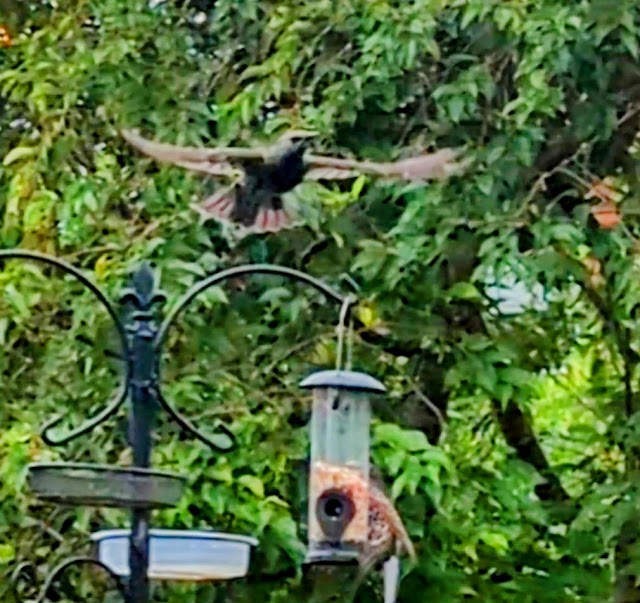
Photo 10: Starling in Flight over the Bird Feeder (31/12/23)


Kicking Up a Storm

 The current UK storm season (September 2023 to August 2024) seems to have been busier than usual with Storm Isha (21-22 January 2024) and Storm Jocelyn (23-24 January 2024) the two most recent examples. From the Met Office warnings, Isha seemed the most threatening of the two storms from Herefordshire's point of view. In reality, we experienced significantly higher wind speeds during Storm Jocelyn, albeit for shorter sustained periods (Figure 1).

Figure 1: Wind Speeds (Average/Maximum) in Hereford (18 - 25 January 2024)

My Davis weather station recorded maximum wind speeds up to 45 km/h during Storm Isha compared with 64 km/h during Storm Jocelyn. In old-fashioned money that would be 28 mph and 40 mph. The highest wind speed observed in our back garden was 66 km/h (41 mph) during Storm Franklin in February 2022. Those winds brought down a shared fence with our neighbour (actually during Storm Eunice, a few days before Franklin); Storm Jocelyn has repeated that feat (Photo 1).

Photo 1: Wind-affected Fence 

Otherwise, the only other obvious damage was a toppled olive bush ...

Photo 2: Toppled Olive Bush

Davis weather stations located on the Welsh Coast (Barmouth) and in Snowdonia (Cwm Penmachno) recorded maximum wind speeds of 103 km/h and 124 km/h respectively, both during Storm Isha. In old-fashioned money that would be 64 mph and 77 mph.

Finally, back to that 'feeling' I had that the current storm season (Sept 1st 2023 to August 31st 2024) was somewhat busier than normal with 10 named storms so far. Figure 2 illustrates the relative 'storminess' of each storm season based on the number of named storms. Data are from here. The Met Office only started naming storms in 2015.

Figure 2: Number of Named UK Storms in Each Storm Season

It seems my 'feeling' was justified because the current storm season is indeed the stormiest of the last 6 years. And who remembers weather events more than 6 years ago unless they were exceptional like the 1987 Great Storm. Of course, that doesn't mean this season is the stormiest ever - Figure 1 shows the 2015/16 season had 11 named storms (although 5 of them occurred on, or after, the 29th January). Nevertheless, the current storm season (2023/24) may still turn out to be the stormiest in recent memory since it has another 7 months to run.

Re-plotting the storm data without the current season's values (Figure 3) suggests a recent trend of decreasing storminess that the current season has bucked. This may, however, be an artefact of too short a time series.


Cluck and Collect

 I may have mentioned before that we are plagued surrounded by houses run by cats. I say run by cats since it is abundantly clear that (i) humans exert no control whatsoever over their cats, (ii) cats do whatever they like, and (iii) cats have no affection for their human hosts other than as a reliable source of food. Our neighbour's cat (Photo 1) was 'picked up' as a stray quite a few years ago through the simple provision of regular meals.

Apart from their somewhat disgusting habit of leaving faecal deposits in other people's garden and the occasional disruption of my hot composting process, the local cat population is more of a nuisance than a pest because I have not seen any evidence that they are killing birds. If you are interested in how many birds are killed by cats (both feral and domestic) in different countries, then take a look here. [note: I have not checked the validity of these statistics but the 1 million birds killed everyday in Australia are based on peer-reviewed science]. For the UK, the resident 11 million cats (or maybe 12 million) kill 27 million birds during spring/summer (or is it 40-70 million every year?).

This morning, I looked out of an upstairs' window to find our neighbour's cat sitting, rather too comfortably (Photo 1), at the foot of the bird feeder (Photo 2).

Photo 2: Bird Feeder (minus cat)

Somewhat predictably, the usual bird activity (Photo 3) had subsided to zero.

Photo 3: Regular Starling Visitors

Was the cat waiting for his/her takeaway meal? Or, perhaps she/he had pre-ordered using click and collect?

The cat just ignored my gesticulations from the upstairs' window, so I had to go outside and shoo him/her off. The garden birds were back within a few minutes.

We've tried plenty of cat deterrents though nothing is 100% guaranteed. I suspect a dog might be the most effective but, while we are happy to look after the kid's pets for a few days (Video 1Video 2), they do limit your freedom and are a bit of a tie.

Video 1: Family Pet #1 (Son)

Video 2: Family Pet #2 (Daughter)

While cats can sometimes be useful (e.g. as a mouser), it does seem dogs have greater utility (e.g. sheepdogs, guard dogs, gun dogs, guide dogs for the blind and deaf, search and rescue dogs, police/military dogs, etc). Which reminds me of this comedic gem by Les Barker (RIP) called 'Guide Cats for the Blind'. Here is a YouTube video of the aforementioned poem:

Video 3: Guide Cats for the Blind read by Les Barker


Road Kill

 Travelling through the Cotswolds recently (15/1/24) on a cold but sunny day, we came across a wake of buzzards feasting on some roadkill. Optional collective nouns for buzzards are a kettle, soar, or committee of buzzards.

Video 1: Buzzards and Roadkill

The road (B4077) from Tewkesbury to Stow-on-the Wold (and vice versa) is an exceedingly pleasant, largely traffic-free, drive through the Cotswolds. Roadkill - including deer, badgers, hedgehogs, rabbits, squirrels, pheasants and other birds - is a fairly common sight despite the relatively low traffic volumes.

The noun 'roadkill' started to become part of common parlance in the UK around about 1960 according to Google Books Ngram Viewer ...

Figure 1: Prevalence of the Word 'Roadkill' in English Literature

... with a rapid rise in usage from about 1983 onwards (Figure 1). Presumably there was road kill before 1960, but maybe not enough for it to be a topic that people discussed or wrote about?

That traffic volumes are a major factor in determining the amount of roadkill was demonstrated by recent studies on the effect of Covid-19 lockdowns on wildlife fatalities; see here, here, here, and here. This Japanese study indicated no reduction in wildlife collisions during the pandemic despite the fact that there was a positive correlation between traffic volume and roadkill numbers before the pandemic.

Figure 2 plots the passenger kilometres travelled, according to mode of travel, from 2012 to 2022. Other modes include buses, trains/trams, cycles, motorcycles and domestic flights. The effect of the pandemic is clear to see.

Figure 2: Passenger kilometres (Great Britain) by Travel Mode (2012 -2022)

Roadkill numbers (Figure 3 taken from here) mirror the changes in passenger kilometres and, particularly, those associated with cars and vans.

Figure 3: Roadkill Numbers (UK) from 2010 - 2020

Roadkill is a major cause of wildlife mortality worldwide as well as in the UK. If we are to protect our wildlife biodiversity then we need to quantitatively monitor roadkill species and devise strategies to minimise fatalities.  There are a number of citizen science projects that record roadkill if you are interested in this topic; for example, The Road Lab (formerly Project Splatter!!) and the People's Trust for Endangered Species.


Power Pause Update 2

 Another Power Pause, another Payday! Offer to participate in the next Power Pause on January 17th was accepted. The Air Source Heat Pumps were turned down a couple of degrees for the one hour duration of the pause and we spent a pleasant hour reading ...

Photo 1: My Reading Choice

Photo 2: Mary's Reading Choice

There was no noticeable change in room temperature despite the sub-zero outside temperatures (-2 ℃) and I had prepared the evening meal (vegetable stew) much earlier in the day using the slow cooker. A few days later we were informed that we had saved 1.846 kWh in energy and earned a rebate of £4.92 (i.e £2.67 per kWh).

In the 2022 trial, 1.6 million households and businesses participated in the Demand Flexibility Service and saved 3.3 GWh (enough to power 10 million UK homes). It isn't clear whether each "Power Pause" had that many participants or that it was just the total number of individual participants over several events.

In addition to easing the National Grid's job of balancing electricity generation with consumer demand, the Demand Flexibility Service has other useful benefits. For example, by maximizing the use of cheaper renewable energy at the expense of the costlier fossil fuel generators. Figures 1, 2 & 3 were taken from the grid.iamkate.com website and show the generation sources used to meet the demand for electricity on Tuesday 16th January (Figure 1), Wednesday 17th January (Figure 2) and Thursday 18th January (Figure 3) this year. Wednesday was the day of the Power Pause.
  1. Electricity demand was fairly constant over the three days (38.8 - 39.8 GWh) but there was a significant drop (3 GW) in power generation from renewables on the Wednesday
  2. From the weather forecast, National Grid would have expected the drop in power generation from renewables (mainly wind)
  3. Also from the weather forecast, National Grid would have been aware that daytime temperatures on Wednesday (maximum 2 ℃ in Hereford) would be lower than either Tuesday (maximum 7 ℃ in Hereford) or Thursday ( maximum 5 ℃ in Hereford)
  4. Following on from points 2 & 3, any extra demand for electricity on the Wednesday would need to be met by bringing expensive and polluting fossil fuel generators online
  5. So Wednesday was a good choice for testing the Demand Flexibility Service
Figure 1: Generation/Demand on Tuesday 16th January 2024

Figure 2: Generation/Demand on Wednesday 17th January 2024

Figure 3: Generation/Demand on Thursday 18th January 2024

By avoiding the use of additional fossil fuel generation, the carbon intensity of the electricity grid is minimised. An additional benefit is the reduced cost of electricity possible by limiting the use of expensive fossil fuel generation.

Figure 4 (taken from grid.iamkate.com) shows the UK Electricity Grid prices during the week beginning Saturday 13th January 2024 and including the latest Power Pause on Wednesday 17th January. Note the small price drop on Wednesday brought about by the use of the Demand Flexibility Service along with some extra electricity imports, especially from France. By avoiding the need to pay coal-fired power stations to fire up just in case, the overall price of electricity reduces.

Figure 4: UK Electricity Grid Prices for Period 13/1/24 to 19/1/24

[Note: the price drop on Friday can be attributed to a large increase in wind-powered electricity; up from 7.34 GW on Wednesday to 15.48 GW on Friday while demand was constant at around 39 GW]

Power Pause Update

Last month, I described the National Grid's Demand Flexibility Service that my energy supplier, Good Energy, calls Power Pause. In that post I reported on the first three Power Pauses that took place on 29th November, 1st December and 5th December. On the first date, I saved 0.407 kWh of energy and recieved a rebate of £1.63 on my electricity bill. There were no energy savings on the two December dates and hence no rebates.

Photo 1: Dusk over Hereford

I noted at the time that the lack of energy savings on the December dates may have been down to the Air Source Heat Pumps (ASHPs) that provide all our heating and hot water. ASHPs work most efficiently when asked to maintain a constant temperature. As a general rule, the ASHPs are 'asked' to maintain a background temperature of 18 ℃ during the day and night. During late Autumn to early Spring, the temperature may be boosted to 20 ℃ during daytime (especially if one or both of us is at home or visitors are expected). This form of thermostatic control does not lend itself to energy savings during the early evening period.

When we were notified of the next series of Power Pauses, I decided to turn down the ASHPs by a couple of ℃ for the duration of the Power Pause plus half-an-hour each side of the Power Pause. The results were as follows:

  • 12th December (17:00 to 18:00 h) - energy saved = 1.374 kWh, rebate = £3.67
  • 14th December (17:00 to 18:00 h) - energy saved = 1.687 kWh, rebate = £4.50
  • 19th December (17:00 to 18:00 h) - energy saved = 0.266 kWh, rebate = £0.71
The first thing to note was the rebate per kWh had dropped from £4 to £2.67. I don't know whether this is down to my energy supplier, the National Grid or just a function of the marginal price for electricity.

The second point of interest is why energy savings were much lower on the final date: 12th December. That is an easy question to answer because I forgot to adjust the ASHP controls due to visitors.

Temporarily turning down the heating for the duration of the Power Pause had no noticeable effect on room temperatures - probably because our house is reasonably well-insulated. Outside temperatures (7 ℃ - 9 ℃) were similar during all three Power Pauses.

In summary, turning down the ASHPs by a couple of ℃ for the duration of the one-hour Power Pauses had no noticeable effect on comfort, saved some energy, reduced carbon emissions and paid for approximately half-a-day's electricity.

There are another six Power Pauses planned so we will see how those turn out.

Popular Posts

Blog Archive