Merry Christmas

Seasons greetings and a happy Christmas to one and all. A mild dampish day (8 ℃ @ 10 am) here in Hereford and no sign of snow!


While Mary has been to church, I have attended to my compost bins, put out the recycling for collection on Monday and dug up some parsnips for Christmas dinner. Just got to check the potato situation and whether I need to dig up some more. The rest of the day is for relaxation, a post-lunch walk, games/puzzles, a bit of cooking and, of course, a WhatsApp catch-up with the children and grandchildren.

Looking forward to 2022...


Potable Water Usage

Our water meter was installed by Welsh Water (Dŵr Cymru) on 18th March 2020. Time for a quick update to see whether we are frugal or wasteful users of potable water.

First of all, let's establish a baseline water usage for UK households. Statista reports the average daily water use per person at around 142 litres; this does not include water used outside the house for watering the garden, washing the car, etc. Other sources suggest similar per-person values for the UK. Welsh Water are promising to add a feature to their website allowing comparison with other customers' water usage.

Surprisingly, most people haven't got a clue how much water they use; nearly 50% of Britons think they use under 20 litres per day.

Showers and toilets account for about half the daily usage. I couldn't believe it when the Guardian reported the average shower takes seven and a half minutes!? When I timed myself this morning, it was longer than a minute but shorter than 2. I was fairly confident we would come under the UK average for daily water use especially considering we also follow the old maxim about toilet flushing: if it's yellow let it mellow, if it's brown flush it down.

After installation of the water meter, I took 'monthly' readings to get a baseline indication of water usage and check for possible leakage. The last 3 measurements are the six-monthly readings of the water company for billing purposes. 

DATE OF READINGNUMBER OF DAYSWATER METER READING (㎥)
18/3/202000
18/4/2020318
18/5/20206120
26/5/20206928
19/6/20209332
18/7/202012242
19/9/202018559
16/11/202024373
17/5/2021425121
30/11/2021623199

Plotting water consumption as a time series indicates a fairly uniform rate of use over the 20 months of data. Linear regression shows an average household daily rate of 307 litres (0.307 ㎥) or 153.5 litres per person per day. [Note: 1 ㎥ = 1000 litres]


At first glance, this was a somewhat disappointing result when compared with the UK average of 142 litres per person per day. However, there are two confounding factors. Firstly, for a three month period in 2021 (June-July-August) the household consisted of four people rather than two. Second, the UK average does not include water used outside the home - in our case this was mainly garden watering.

To account for the change in household numbers for the 3-month (90 day) period, I guesstimate our two extra guests each used 100 litres/day - so 200 litres/day in total - because they were not around all the time. This amends the water usage plot above to that below and a new average of 142 litres/person for our 2-person household, in line with the UK average. Our average also includes garden watering which the UK average does not.

Estimating the amount of water used in the garden is difficult. The excellent straight line correlation in the plots above suggest fairly uniform use throughout the year which would imply limited potable water use for irrigation. The last 3 readings (see Table) cover a Winter/Spring (16/11/20 to 17/5/21) and a Summer/Autumn (18/5/21 to 30/11/21) period. After allowing for the extra guests during the Summer, average daily water use went from 264 litres/day in Winter/Spring to 303 litres/day in Summer/Autumn. Hence, about 50 litres/day, on average, during the growing season (May to September) of which roughly 25 litres/day is used for the Quadgrows in the Polytunnel.

Is 50 litres/day a big number or a small number? This website from the University of California suggests a 3 square metre plot needs 90 litres/week in summer. So my vegetable plot (100 square metres) requires 430 litres/day. Some of this will come from rainfall, but it does confirm that 50 litres/day is a very efficient use of water. Especially when that 50 litres/day includes irrigation of the rest of the garden which is about another 150 square meters. Our waterbutts (about 3000 litres) undoubtedly help keep the total potable water use to a low level.


Sleazy does it

 Woke up this morning to find England not doing too well in the second Ashes test match and a big swing to the LibDems in the North Shropshire by-election. Overturning a 23,000 Tory majority in a seat the Conservatives have held for 200 years is no mean feat. However, there can be little doubt this was mainly down to a protest vote against numerous examples of Tory sleaze (including that of Owen Paterson, who's resignation caused this by-election) plus general dissatisfaction with the current Government's performance and that of the Prime Minister, Boris Johnson, in particular. It took me all the way back to 1997 when Martin Bell stood, and won, as an Independent MP against the incumbent Tory MP, Neil Hamilton, who was embroiled in sleaze allegations. Plus ça change.

It was nice to see the Official Monster Raving Loony Party still going if not going that strongly. If we ever return to normal again, we can expect the Conservatives to retake the seat at the next election.

The only reason I posted about this was a notification in my inbox for a post by Tim Harford in the Financial Times: What Parking Tickets Tell Us About Corruption. Tim's post made a number of interesting points on the topic of sleaze and corruption and I recommend reading it. To be clear, corruption is not restricted to the Conservative Party but is more often associated with the party in Government. And the situation in the US seems to be much worse, perhaps because their politics are even more polarised than ours in the UK.

Seasonal Changes in the Garden - November 2021

Follow this link to see previous months of the year.

The biggest changes in the garden often take place in November as the late autumn winds strip the leaves from the trees. Everything starts quietly enough at the beginning of the month; a green lushness pervades the garden but there are hints of autumn colour. Note the yellow marrow/courgette on the patio table - how long has that been there? It doesn't survive much longer and will soon be turned into delicious soup.


By the middle of the month, the autumn colours are becoming more pronounced, especially the acer in the foreground.


Following Storm Arwen on the 26/27th November 2021, leaf-loss from the trees was greatly accelerated.


One of the advantages of leafless trees is that you can see the garden birds much easier. Here is a photo (taken through a window) of a visiting mistle thrush on 29th November. It is not the first thrush seen in the garden; that was a redwing seen 5-6 years ago. Nevertheless, the first garden thrush captured on camera. 


The thrush is now a daily visitor while there are still berries on the mountain ash. A few days later (in early December) it was joined, briefly, by a redwing (sorry, still no photo).

Other avian visitors in November include blackbirds,  collared doves, crows, house sparrows, magpies, starlings, wood pigeons, lesser black-backed gull, robin, blackcap, great tits and blue tits; seen here enjoying peanuts.


The monthly weather summary for November 2021 is given in the table below. Overall, warm and dry but turning colder at the end of the month. Storm Arwen on 26/27th of the month brought destructive winds to the UK; mainly to northern England and Scotland. Herefordshire lost a few trees but escaped largely unscathed.

November 2021 (2020)

Weather Parameter

Value

Dates

Average Monthly Temperature 

8 oC (9 oC)


Maximum Monthly Temperature

17 oC (18 oC)

18th

Minimum Monthly Temperature

-2 oC (-1 oC)

29th

Number of Air Frost Days

5 (4)


Number of Hot Days (> 25 oC)

0 (0)


Monthly Precipitation

8.8 mm (47.8 mm)


Greatest 24 h Precipitation

3.2 mm (10.2 mm)

27th - 28th

Number of Dry Days

23 (13)


Monthly Sunshine Hours (estimated)

51 (53)


Average Wind Speed

3 km/h (3 km/h)


Highest Wind Speed

58 km/h (50 km/h)

26th

Maximum Barometric Pressure (Sea Level)

1035.4 hPa (1040.6 hPa)

23rd

Minimum Barometric Pressure (Sea Level)

988.1 hPa (978.4 hPa)

1st

Average Barometric Pressure (Sea Level)

1018.1 hPa (1018.1 hPa)


Seasonal Changes in the Garden - October 2021

 For previous months in 2021, see here.

You never quite know what to expect weatherwise in October. Many people remember the October 1987 hurricane though, strictly speaking, it was a tropical storm. It is one of those events where everyone is supposed to remember where they were and what they were doing. Alas, not me! I was almost certainly at home in West London sleeping through it all because Michael Fish, the BBC weatherman, had assured us there would be no hurricane. Other parts of the country were less fortunate. Nearby Kew lost 700 trees and Wakehurst (Kew in the country) lost 20,000.

October can also be blessed with late summer warmth. England was warmer than Athens, Barcelona or Los Angeles on October 1st 2011 when the mercury reached over 29 ℃. And we are not usually short of rain in October.

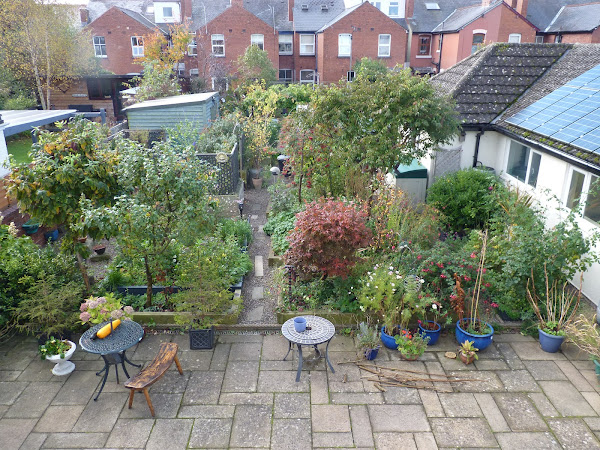
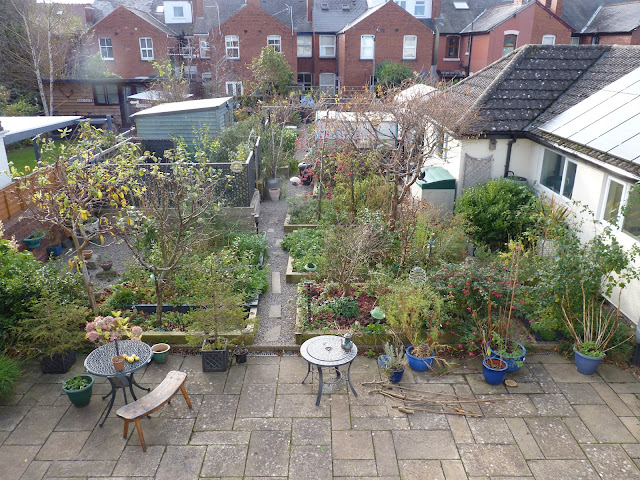
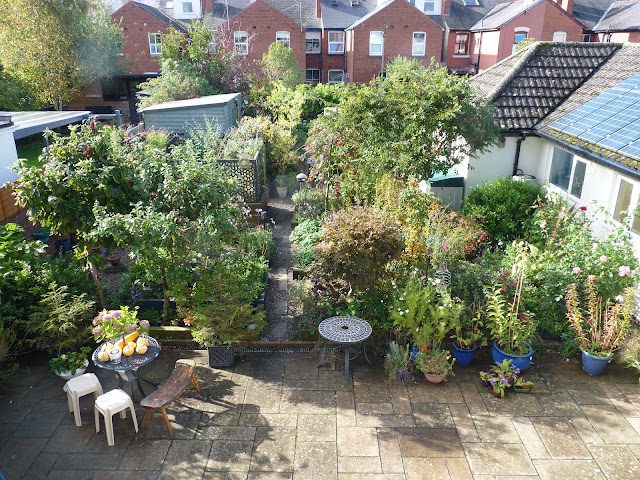
In Hereford, October started out sunny and pleasantly warm as this photo, below taken on 1st October, shows. Plenty of greenery with the odd splash of colour from the roses, cosmos and fuschia.


By the middle of the month (14th), the final cucumbers and tomatoes had been harvested from the polytunnel (see table).


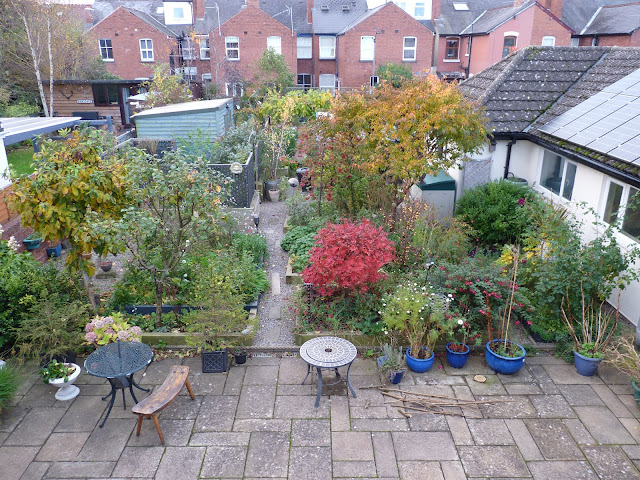
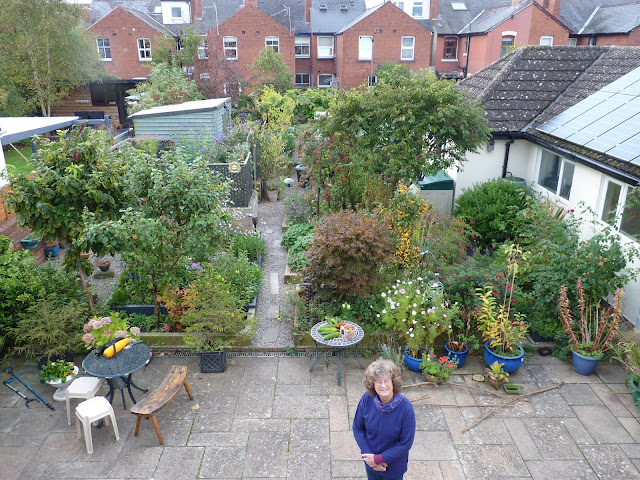
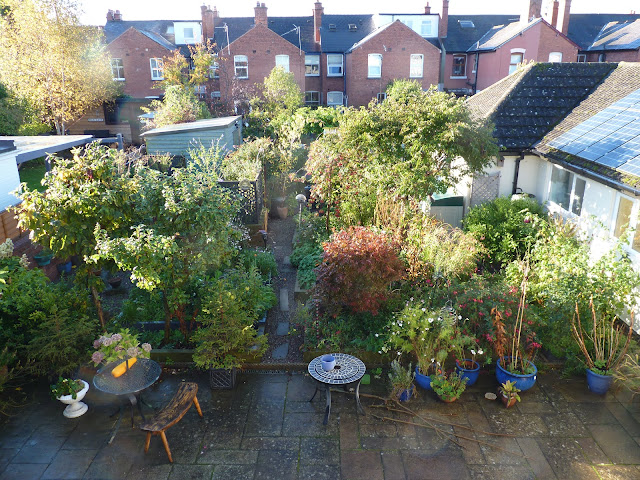
Come the end of the month (31st), there are clear signs of autumn colours starting to develop, particularly in the Acer (foreground). This month has been not too windy so the trees have kept their leaves.


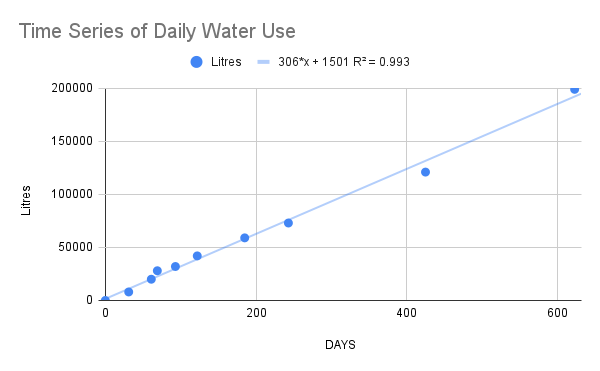
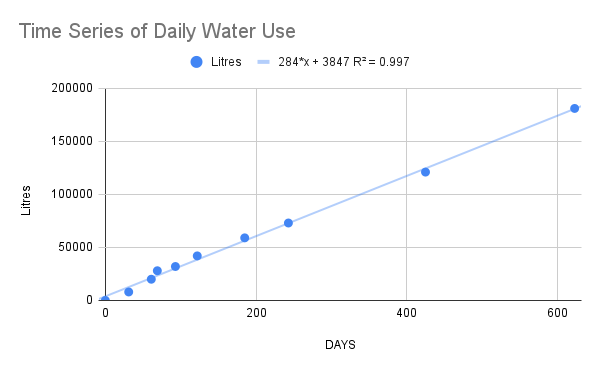
Weather data for October 2021 are collated in the table. Warm and wet is probably the most concise description of the weather this month. 

October 2021 (2020)

Weather Parameter

Value

Dates

Average Monthly Temperature 

13 oC (11 oC)


Maximum Monthly Temperature

20 oC (18 oC)

10th

Minimum Monthly Temperature

3 oC (4 oC)

22nd

Number of Air Frost Days

0 (0)


Number of Hot Days (> 25 oC)

0 (0)


Monthly Precipitation

114.2 mm (97.0 mm)


Greatest 24 h Precipitation

13.6 mm (37.4 mm)

19th - 20th

Number of Dry Days

15 (7)


Monthly Sunshine Hours (estimated)

74 (76)


Average Wind Speed

3 km/h (4 km/h)


Highest Wind Speed

43 km/h (39 km/h)

31st

Maximum Barometric Pressure (Sea Level)

1033.1 hPa (1028.2 hPa)

11th

Minimum Barometric Pressure (Sea Level)

984.4 hPa (978.4 hPa)

31st

Average Barometric Pressure (Sea Level)

1006.6 hPa (1007.7 hPa)


Popular Posts