Here is a graphical presentation of the weather in Hereford* in 2022 [*as recorded by my Davis Weather Station]. Click on each plot for a larger image.
First, the daily average, maximum, and minimum temperatures [note: differing temperature scales]. Note, in particular, the number of days (10) when the temperature reached or exceeded 32 ℃ (definitely not normal!), the two cold snaps in January and December (both about 10 days long), and the last frost on April 10th.


It is all very well to record the actual temperatures but, perhaps, of greater interest is how hot or cold it feels outdoors as this will influence how we dress, what activities we do, etc. This is where the THSW Index comes in. At a basic level, measuring temperature and humidity allows a Heat Index to be calculated to provide an 'apparent' or 'perceived' temperature. Since wind has a cooling effect (chill factor), a better estimate of 'perceived' temperature would include this wind factor - hence the THW Index (the 'apparent' outdoor temperature in the shade. Air temperatures are recorded using shaded thermometers, e.g. housed in a Stevenson Screen, to avoid solar radiative heating of the temperature-measuring instrument (e.g. glass thermometer). As we all know, it feels warmer in the sunshine than the shade so we need to include a sun factor to have a more realistic perception of how warm it feels when outdoors enjoying the sunshine. This is where the THSW Index come in.
The plot below shows the daily maximum THSW Index for Hereford throughout 2022. Note, in particular, that 'apparent' temperatures reached 40 ℃ or more on three occaisions in 2022: twice in July and once in August with a highest 'perceived' temperature of 43 ℃ (also known as unbearably hot!)

The next plot (below) shows both the high THW (green) and high THSW (red) indices demonstrating the benefits of staying in the shade during the summer months and getting out into the sunshine during the winter months. Shade reduces the 'perceived' summer temperatures by about 7 ℃ whereas sunshine increases 'apparent' winter temperatures by 2 - 3 ℃ when the sun is lower in the sky.

In the UK, we are generally concerned only with heating degree days since, for most residential properties, summer air conditioning involves opening windows, closing curtains, and (in extreme heat) using an electric fan! In any case, both heating and cooling degree days for 2022 in Hereford are shown below. I suspect the base temperature used for these graphs is 65 ℉ (the US standard); I'm checking with my supplier whether this can be changed.

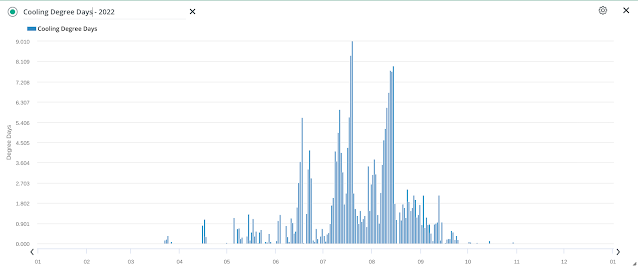


No real surprises here. The peak in the December heating degree days coincides with the cold snap experienced at the end of last year and the summer cooling degree days peaks correlate exactly with the highest daily maximum temperatures.
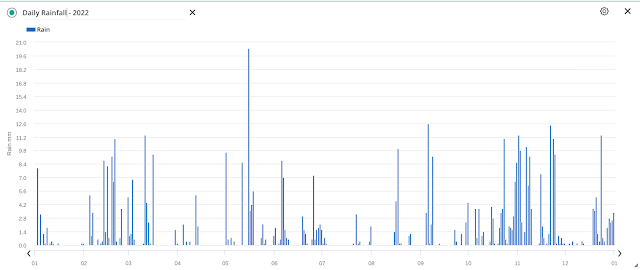
The amount and frequency of precipitation events (rain, if you like) are shown next. Note that the cold snaps coincided with dry spells hence, as far as I can remember, no snow to speak of in 2022.

Let's now take a look at Daily Solar Radiation values measured in Watts per metre-squared. I use average daily solar radiation as a proxy for sunshine hours in my monthly reports. Generally, we would expect a Gaussian or Normal distribution for both measures of solar radiation with a 'peak' around the summer solstice. Gaps indicate periods of cloudy weather (with or without precipitation).

Our final plot considers daily maximum UV indices. Values between 0 -2 (bottom two rows) are considered low risk for the 'average' person meaning January - March and October - December were low risk for Hereford residents in 2022.
An index rating of 3 - 5 (rows 4 & 5) presents a moderate risk where avoiding the midday sun, protective clothing, sunscreen and sunglasses are highly recommended. For Hereford in 2022, this index rating covered the months of April to September inclusive.
June and July are the high risk months as the UV Index hits 6 - 8 and occasionally 9. Stay in the shade between 10 am and 4 pm or avoid going outside! Don't forget sunscreen, protective clothing and sunglasses! Enjoy the early mornings and cooler evenings where possible!


0 comments:
Post a Comment