First Cutting of the Greensward in 2022

We do not have a lawn. There wasn't much of a lawn when we moved here and we quickly decided it had to go and be replaced with trees and plants.

Lawns require a level of care and maintenance that far outweighs their usefulness, in our opinion, and they are severely lacking in biodiversity. That is not to say lawns are bad per se; they can be great as a childrens' playground, croquet pitch, badminton court, cricket square, etcetera, etc. And if you're not 'into' gardening then it may be a simpler option and far better than paving over the garden.

We are, however, grateful to our next-door neighbours for donating their grass cuttings so I can compost them. I will discuss the value of grass mowings in the composting cycle in future posts.

Yesterday, we received the first cutting of the year from our neighbour's turf: 27th February 2022. My first thought was that this seemed early. Checking my 'compost' records, where I note the types of material added to my hot composting bins, I discovered the first cut in 2020 was 19th March while for 2021 it was 15th March. So my first thought was indeed correct; this year's first greensward cut was, by two to three weeks, the earliest recorded (albeit, the record only goes back to 2020!).

This is another example of phenology. Obviously, the record is too short to draw any conclusions at the moment but it may be a useful proxy for changes in weather and climate.


Hereford Floods - February 2022

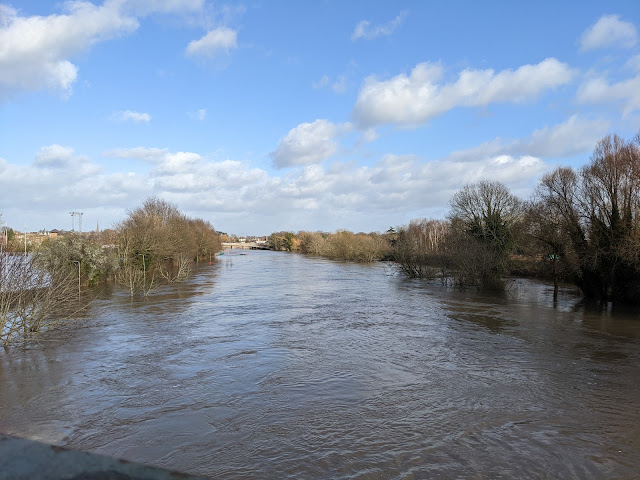
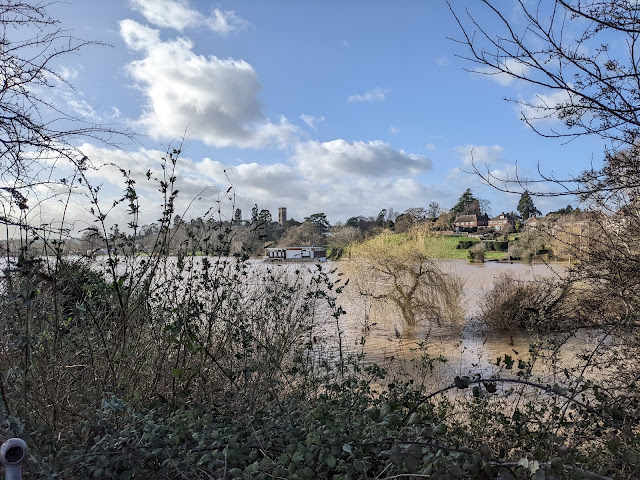
After three named storms in a week - Dudley, Eunice and Franklin - the wind subsided and the sun came out. Yesterday, it was time (3 pm, 21/2/22) to get some fresh air with a walk down to the River Wye. Rain in mid-Wales, where the source of the River Wye lies, takes 24-48 hours to work its way downstream to Hereford. If there is lots of rain in mid-Wales, then Hereford is susceptible to flooding.

Trying to find out how much rain had fallen in mid-Wales proved more difficult than I expected. I found this newspaper report saying 150 mm (6 inches) had fallen in upland Wales which had led to severe flooding along the River Severn. Eventually, I found a weather station (on the Davis Weatherlink network) at Rhyader that showed 203.2 mm (8 inches) of rain over the period of the three storms. The average rainfall in Rhyader is 100 mm (4 inches) for the whole of February! 

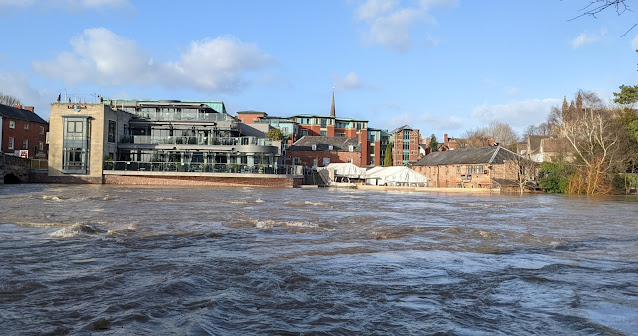
This photo was taken from the Hunderton Bridge on the Great Western Way looking towards the city. The river level was 5.2 metres (normal range 0.1 metre to 3.30 metres) and still rising, reaching its maximum (5.38 metres) about 6 hours later.

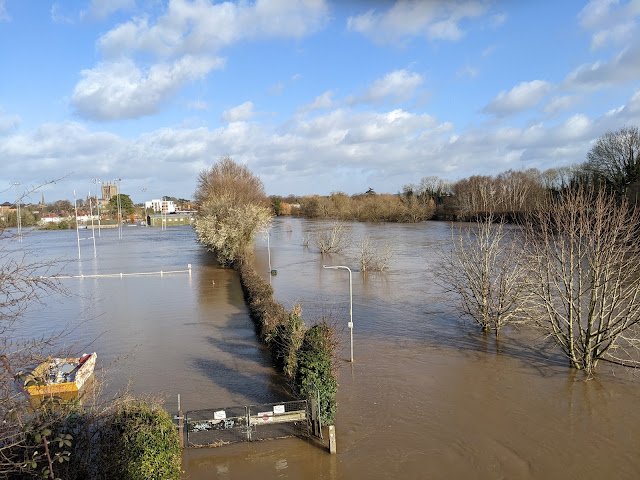
I guess there will be no rugby played this weekend at Hereford RFC...


...and fortunately, it is half-term for Hereford Cathedral School as the playing fields are under water...

February 2022 floods in Hereford

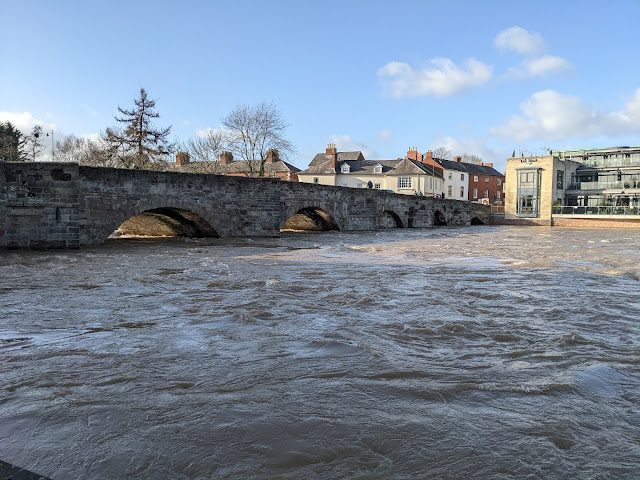
...the old Wye Bridge (built 15th Century, rebuilt/widened 17th Century, grade 1 listed) was temporarily closed at peak flood levels but lives to tell another day... 


...while De Koffie Pot (centre-right), one of our favourite eating and meeting places, just about avoided the flood water unlike 2 years ago; the benefits of some extra flood barriers clearly paid off...


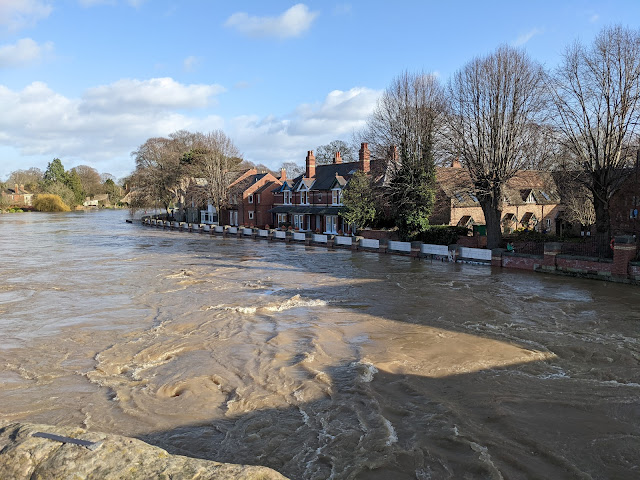
...meanwhile, this picture taken from the old Wye Bridge shows the flood barriers in place protecting the houses and businesses alongside the river...


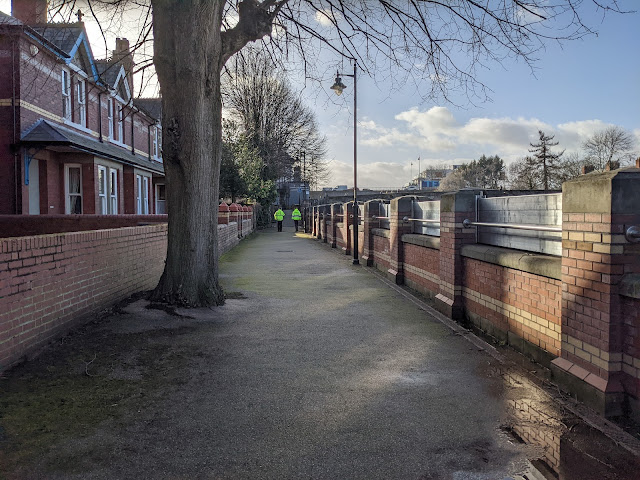
...with this view from the other side of the flood barriers showing what a good job they do. The Environment Agency still had people (yellow jackets) and equipment on site as the peak flood level was still a few hours off...


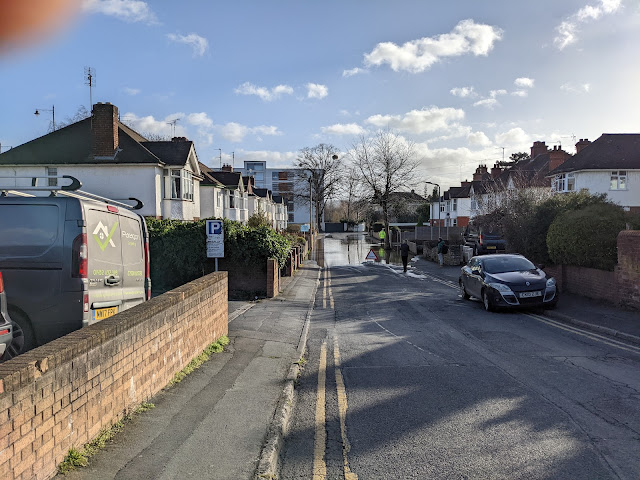
... and finally, on my way home, I took this photo of Greyfriars Avenue which runs down to the river and Hereford Rowing Club...


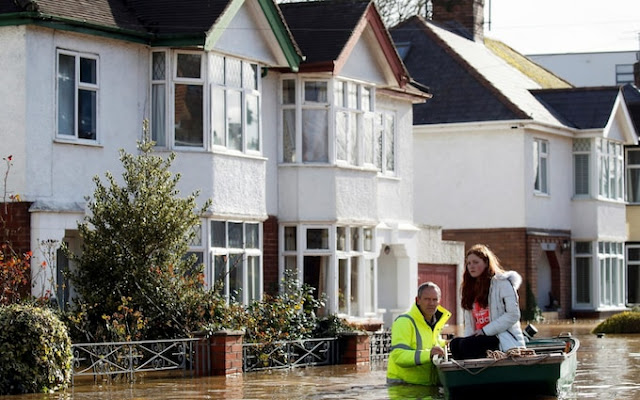
Two years ago, this road and its houses were severely flooded - it looked more like a canal as this picture from The Telegraph shows...


February 2020 had the highest flood levels (6.1 metres) ever recorded at Hereford Bridge Station due to a combination of Storm Dennis and exceptional local precipitation (100 mm, or nearly 4 inches, in 24 hours). This year, local precipitation was modest (26.8 mm over 3 days) which certainly helped.

Thankfully, as I post this, the floods are receding and levels are already below 4 metres.


First Daffodil of Spring


Continuing on the theme of early spring flowering, this pot of daffodils was blooming on February 10. They may have flowered a few days earlier but were tucked away so not on show. Located on a sunny patio, these are expected to be the first to flower in the garden. The ground-planted daffodils in the Secret Garden are in bud - but have a north-facing aspect so will flower later.


The flowering daffs shown in a previous post do not count as they were purchased this year from a market stall and will have been brought on in a glasshouse.

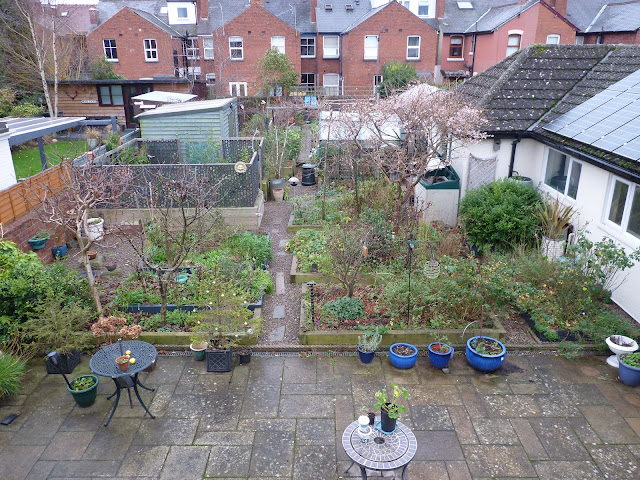
View from the Rear Window - January 2022

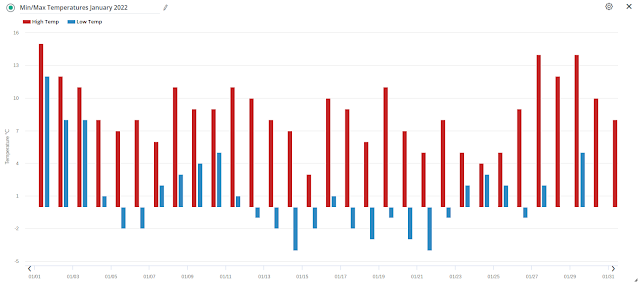
January 1st 2022 was unseasonably warm with a maximum daytime temperature of 15 oC and a minimum nighttime temperature of 12 oC. Generally quiet in the garden with the winter-flowering cherry still producing and the sweet scent of Sarcococca brought out by the warmth...

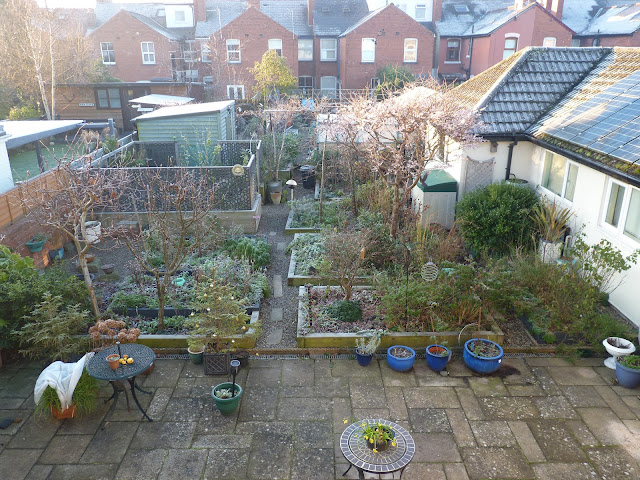
...the middle of the month (12th - 22nd) featured a period of regular night frosts - illustrated here by this photo from the 13th...

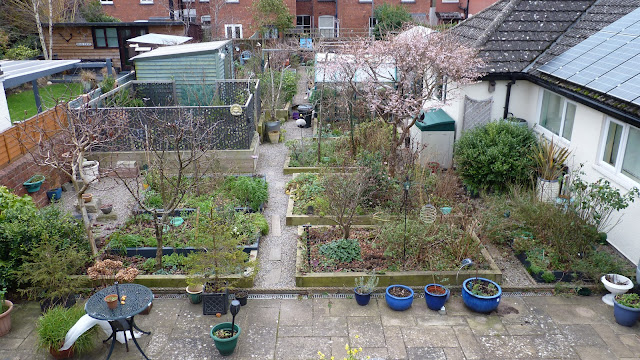
...while the end of the month (26th - 31st) had warm days (mean 11 oC) and cool nights (mean 2 oC)...

Jobs in the Garden

Although January can be a quiet month in the garden, there are still a few things to do.

1. Composting continues throughout winter using the hot composting process. Only one of my three hot composters runs over winter because of the lower volumes of kitchen and garden waste.

2. Early Purple Wight soft-necked garlic was planted outside on 1st January after starting off in the cold greenhouse three weeks earlier

3. Last of the Blue Danube potatoes dug up (about 20 kg)

4. Final celeriac roots dug up from the Greenhouse Sensation vegetable planter

5. Continue to harvest parsnips, kale, chard and brocolli harvested from the kitchen garden

6. Start pruning grapevines

7. New seed potatoes arrive (Blue Danube from D.T. Brown); placed in trays to chit

8. Add mature garden compost to fruit bed (grape, blueberry, raspberry)

January 2022 Weather

Summary of key weather parameters are collated in the table below:

January 2022

Weather Parameter

Value

Dates

Average Monthly Temperature 

9 oC


Maximum Monthly Temperature

15 oC

1st

Minimum Monthly Temperature

-4 oC

14th & 21st

Number of Air Frost Days

15


Number of Hot Days (> 25 oC)

0


Monthly Precipitation

15.8 mm


Greatest 24 h Precipitation

8.0 mm

1st - 2nd

Number of Dry Days

20


Monthly Sunshine Hours (estimated)

44.5


Average Wind Speed

3 km/h


Highest Wind Speed

45 km/h

29th

Maximum Barometric Pressure (Sea Level)

1043.1 hPa

12th

Minimum Barometric Pressure (Sea Level)

992.8 hPa

8th

Average Barometric Pressure (Sea Level)

1025.3 hPa


A graphical representation of the daily minimum and maximum temperatures is presented below. This shows a period of warm days and nights at the very beginning of the month, frosty nights in the middle, and warm days with cool nights at the end of the month.


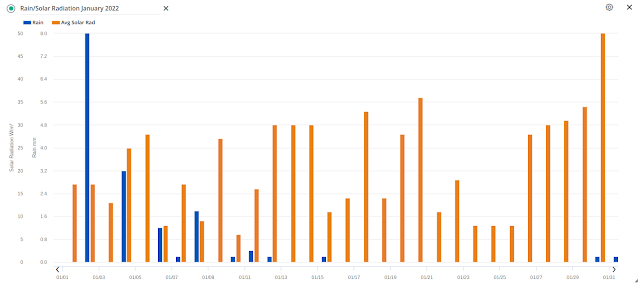
The next plot shows the daily rainfall and average solar radiation for January 2022. Rainfall was low and occurred, mainly, at the beginning of the month. The warm days/nights at the beginning of the month were overcast/wet whereas the warm days/cool nights at month-end were sunny with generally clear skies at night.


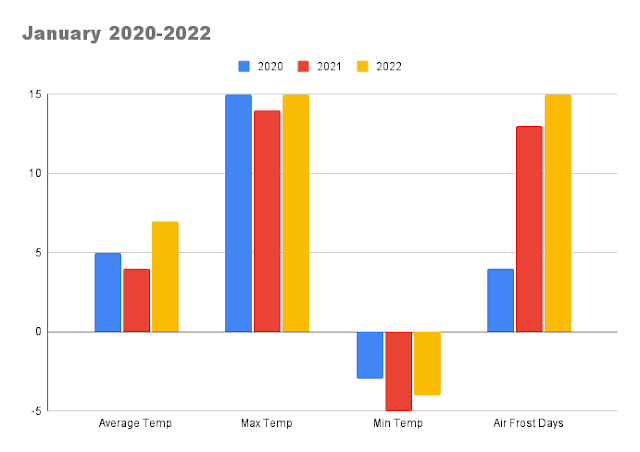
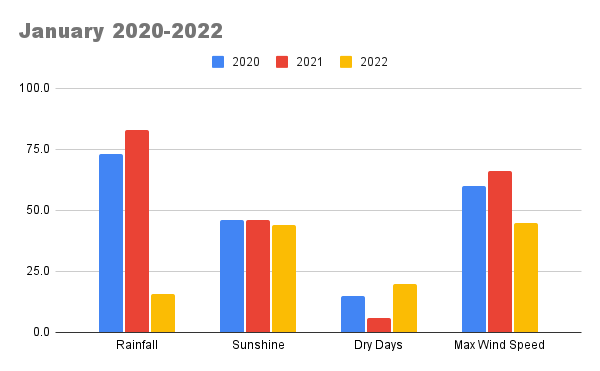
Finally, January weather parameters for 2020, 2021 and 2022 summarised below.


Compared with the earlier years (2020 & 2021), this January was warm, though with a high number of frosty nights, while sunshine hours were average and rainfall was low. The Met Office reported January 2022 as England's sunniest since 1919. This appears to contradict the data from my Davis weather station until you look in more detail at the Met Office report. Sunshine hours were low to average in the south and West Midlands (where Hereford resides) but very high in East Anglia, East Midlands and the North East. Early flowering snowdrops & cowslips (on New Year's Day) were a consequence of a warm January.


Storm Eunice

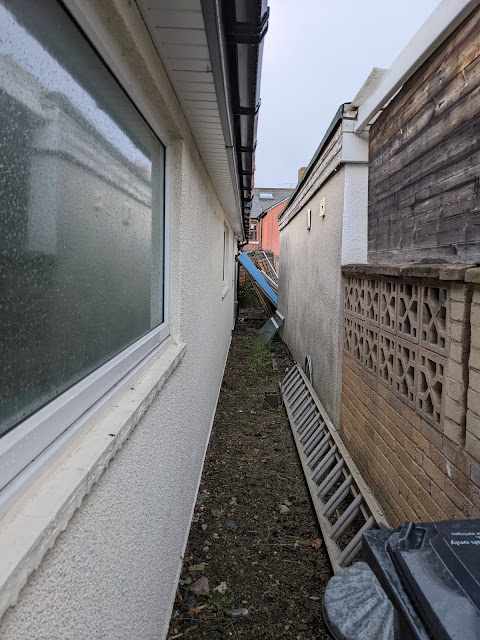
 Yesterday (18 February 2022) was spent hunkered down at home as Storm Eunice approached and passed. The only damage was a shared fence with our next-door neighbours...


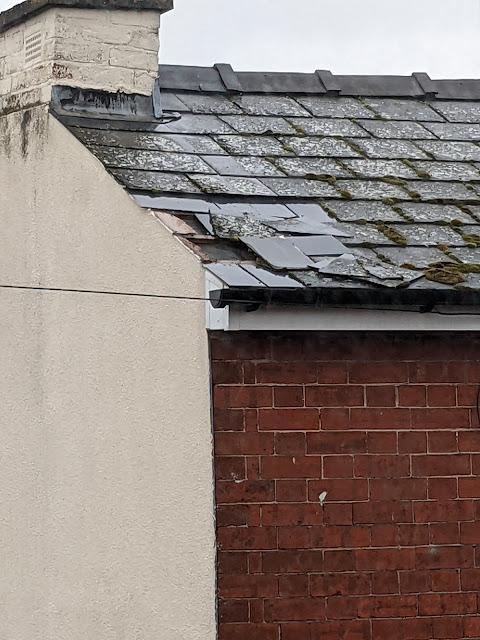
Unfortunately, our neighbours across the road suffered some roof damage...


Our Davis weather station recorded a peak gust of 64 km/hour (40 mph in old money!). We live in a built-up area and the anemometer is positioned about 5 metres (16 feet) above ground level so is not expected to see the full force of the wind.

Checking back over the historical data from our weather station (since Nov 2019), I can see there are only 4 occasions when gusts over 60 km/h were recorded. These all coincide with named storms.

11 January 2020: Brendan (60km/h)
5 February 2020: Ciara (61 km/h)
17 January 2021: Christoph (66 km/h)
18 February 2022: Eunice (64 km/h)

So, although Eunice did not have the highest wing speed, beaten a short head by Christoph, it definitely caused more damage.

Storm Arwen in November 2021 'only' achieved a gust of 58 km/h.


Common Hill Nature Reserve and the Big Farmland Bird Count

 We have posted previously about Common Hill Nature Reserve, near Fownhope, Herefordshire. The voluntary Warden asked if we could do an avian survey as part of the Big Farmland Bird Count. This is a good time of the year for spotting as the birds have nowhere to hide in the, largely, leafless trees. On the downside, it can be a bit windy, wet and cold in February. Nevertheless, we popped over to Common Hill on the afternoon of February 12 to see what we could see and take a few more photos. Go to the end of this post to see which birds we saw on our visit.

View from the entrance of Common Hill next to small car park (you can just see Mary's legs as she tries to hide off shot)...

...view from the corner of the orchard in North Meadow...

...view from the bench at the top of North Meadow...

...looking up Monument Hill from the Herefordshire Wildlife Trust sign...

...looking down Monument Hill from the bench...

...looking down Round's Meadow..

...and the Old Cider House from near the entrance gate...

Bird List (Common Hill, overcast, 8 oC, 3 pm, Saturday 12 February 2022)

Blackbird   (x3)

Blue Tit   (x6)

Buzzard   (x1)

Coal Tit   (x1)

Collared Dove   (x1)

Fieldfare   (x15)

Great Spotted Woodpecker   (x1)

Great Tit   (x2)

Pheasant   (x1)

Robin   (x2)

Rook   (x1)

Woodpigeon   (x8)

Phenology - Real Time Observation of a Warming Planet

Phenology is the study of cyclic/seasonal phenomena in the natural world; e.g. the emergence of leaves, buds, flowers & fruits in plants, the first cuckoo call of Spring and the appearance of frogspawn in the garden pond. Variations in the timings of these natural events are used as proxies for changes in climate and habitat.

It has become abundantly clear to naturalists and, indeed, anyone who spends a significant amount of time outdoors (farmers, gardeners, anglers, ramblers, etc), that Spring now arrives earlier and Autumn finishes later than it did even 30 years ago (the generally-accepted time period for detecting climatic change).

So this item on the BBC website, UK plants are now flowering a month earlier due to Climate Change, caught my eye. The BBC is generally better at reporting science than, say, the Daily Mail but I will always revert to the primary source, if it is readily available, to check whether the science journalist has correctly reported the scientific findings. Fortunately, the scientific paper on which the BBC based its story is free and available here. So I downloaded a copy and read it.

[tl:dr the BBC report accurately reflects the scientific paper]

The paper is titled 'Plants in the UK flower a month earlier under recent warming' and is published in the Proceedings of the Royal Society B (Buntgen U et al, Proc. R. Soc. B 289), a peer-reviewed journal.

The authors analysed nearly 420,000 observations, taken between 1753 and 2019, of the First Flowering Date (FFD) of 406 UK plant species. The geographical spread of the observations was impressive from the Channel Islands in the south to the Shetland Islands in the north and from Northern Ireland in the West to Suffolk in the east. Herbaceous plants (54%) made up the largest group followed by trees (33%).

The most robust data (i.e. most observations) are from 1952 to 2019 that can be divided into two 34-year periods for comparison: 1952-1985 (< 1986) and 1986-2019 (>1987).

There were sufficient data points to enable the authors to differentiate FFD between 'north' and 'south' (above or below Manchester), 'rural' and 'urban' and 'high' and 'low' (above or below 82 m elevation). There is a lot of information in this paper which can be distilled into a few key points. As you would expect from any good scientific study, the authors discuss deficiencies in the data set and differentiate between facts and opinion. In summary:

  • FFD for herbaceous plants is, on average, 32 days earlier for the current period (1987-2019) compared with the earlier period (1952-1986)
  • FFD for trees is, on average, 14 days earlier for the current period (1987-2019) compared with the earlier period (1952-1986)
  • FFD for the 'north' is, on average, 29 days earlier for the current period (1987-2019) compared with the earlier period (1952-1986)
  • FFD for the 'south' is, on average, 25 days earlier for the current period (1987-2019) compared with the earlier period (1952-1986)
  • FFD is, on average, only 5 days later in the 'north' compared to the 'south' in the current period (1987-2019) but used to be 9 days later in the earlier period (1952-1986)
  • FFD for 'urban' areas is, on average, 25 days earlier for the current period (1987-2019) compared with the earlier period (1952-1986)
  • FFD for 'rural' areas is, on average, 27 days earlier for the current period (1987-2019) compared with the earlier period (1952-1986)
  • FFD is, on average, 2 days later in 'rural' areas compared to 'urban' areas for the current period (1987-2019) but used to be 4 days later in the earlier period (1952-1986)
The authors propose a hypothesis to explain the evidence (observations/measurements) by first considering which factors might affect FFD? Global warming is an obvious one but we would also want to consider photoperiodism (daylight length), fewer/less severe frosts, changes in precipitation, wind speed, pollinating insects, urban sprawl, etc. An educated guess would be that if late winter/early spring temperatures were warm, these would encourage early flowering [NB: mean FFD were mid-April to mid-May]. The authors found statistically-significant correlations between FFD and the January - April maximum temperatures; February mean, maximum and minimum temperatures were more significant than those of January, March and April. 

In plot (a) below, taken from the Buntgen et al paper, mean FFD are plotted as a time series. Around the mid-1980s, there was a change in the Winter Index of the North Atlantic Oscillation (NAO) from negative to positive mode which coincided with the FFDs becoming earlier and earlier. In plot (b), mean January-April maximum temperatures for the British Isles (orange) skillfully model the changes in FFDs. This forms the basis of the authors' hypothesis: over the last 30-35 years, the increasing winter/spring maximum temperatures arising from a combination of global warming and a positive NAO are causing  FFDs to become earlier and earlier. A scientific hypothesis must be falsifiable; in other words the hypothesis must be testable and have some predictive properties. For example, if the NAO switches back to its negative mode then we would expect the trend to earlier and earlier FFDs to slow down or even reverse if global temperatures stop rising.


FYI:  The NAO is a weather phenomenon over the North Atlantic Ocean resulting from variations in the pressure differential between Icelandic low pressure and Azores high pressure regions. A positive NAO means warm wet winters in the UK whereas a negative NAO brings cold dry air. Below is one example of an NAO index based on December-March pressure data showing the shift from negative to positive NAO, albeit with considerable interannual variability.
Popular Posts

Blog Archive