In the previous post, I mentioned that one of the data outputs from the Weather Station is the Heating Degree Day (HDD). The relationship between mean daily temperatures and daily HDD is illustrated in the plot below for our Hereford-based weather station covering all 12 months of 2022.
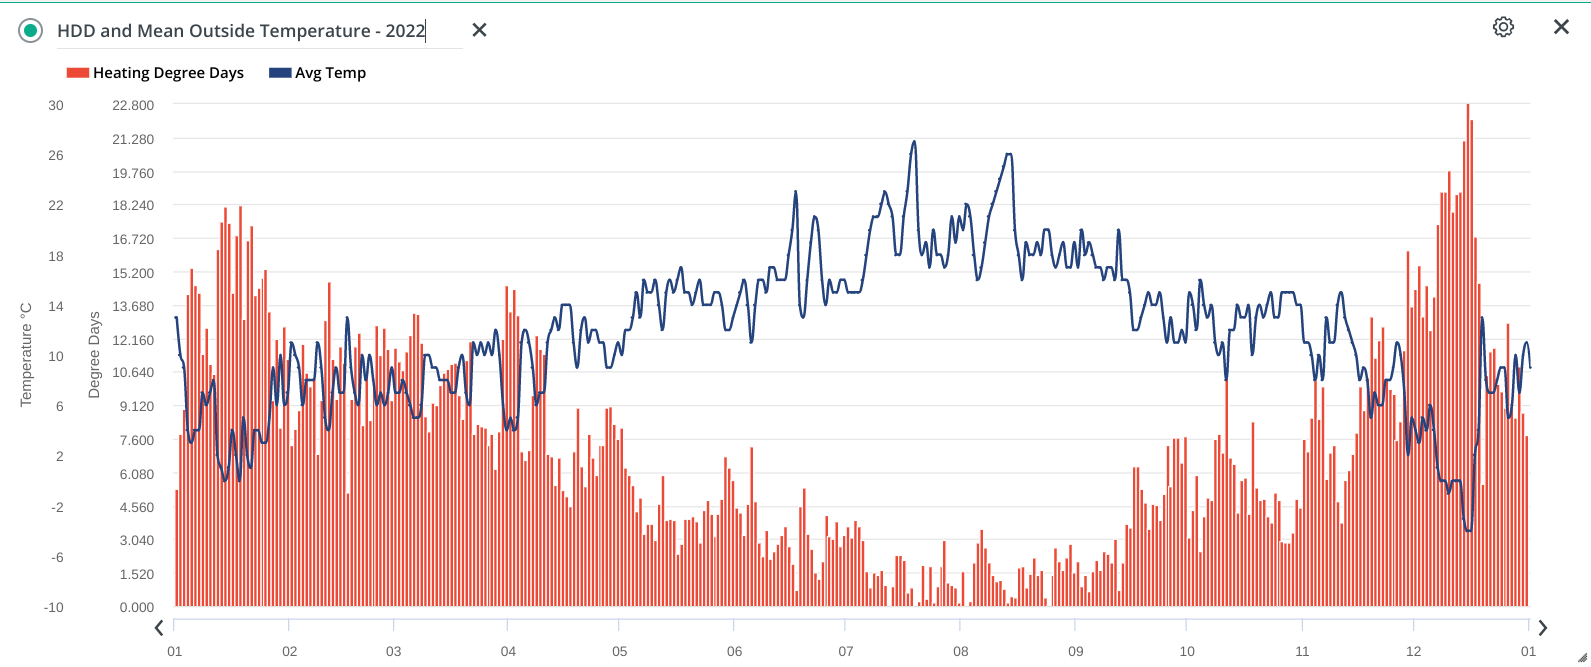 |
| Figure 1: Mean Outside Temperature/HDD for Jan - Dec 2022 |
In principle, HDDs can be used to estimate the daily heat energy demand for a building by taking into account the daily outside temperatures. Depending on geographical location, there is an agreed base temperature where the building's heating comes on if the outside temperature drops below this base. For example, in the USA the base temperature is 65 ℉ (18.3 ℃) whereas in the United Kingdom (UK) it is 15.5 ℃ (60 ℉). The Swiss are clearly hardened against the cold as their base temperature is only 12 ℃!!
On a daily basis, you calculate the HDD by subtracting the average outside temperature from the base temperature:
Average (Mean) Temperature = (Tmax + Tmin)/2
HDD = Base Temperature - Average Temperature
If the mean outside temperature is above the base temperature then HDD is always 0 (zero). If the daily mean outside temperature is, say, 10 ℃ (50 ℉) when the base temperature is 15.5 ℃ (60 ℉) then the HDD value for that particular day will be 5.5 HDDs [in units of ℃ HDDs]. However, because our American friends still like to work with the Fahrenheit scale, they will record this as 10 HDDs except, of course, they use a 65 ℉ base temperature so will, in fact, report a value of 15 HDDs [in units of ℉ HDDs]. If you are still having trouble, consult the Wiki page!
One advantage of my Davis system is that HDD is calculated every 15 minutes for a much more accurate HDD value compared with the use of just daily maximum and minimum temperatures as above. The Davis system allows you to select how often but every 15 - 30 minutes is a good compromise. For example, the minimum and maximum daily temperatures were 0 ℃ and 13 ℃ respectively on January 3rd 2023 which calculates to a HDD of 11.8 (18.3 ℃ minus 6.5 ℃). On the other hand, when calculating the HDD using fifteen minutes packets throughout the day, the HDD value is 9.8. The difference is not always this great but the more accurate method does seem to give lower HDD results so could be significant over the whole year.
From the prior discussion, it follows we would expect HDDs to correlate with the energy used (kWh) to heat a building. Our detached house is split into the Main House and the Annexe, each with its own Air Source Heat Pump (ASHP). The plot below shows the monthly energy use for each ASHP - along with the combined total - for 2022.
 |
| Figure 2: Energy Consumption (kWh) for ASHPs |
Note the similarly shaped plots in Figures 1 & 2 for HDDs and heating energy used. We would therefore expect a good correlation between HDDs and the energy used by the ASHPs to keep the house warm. Fortunately, the ASHPs have their own monitoring system so we can isolate electricity used for heating from the other uses of electricity (such as writing this blogpost!). Both ASHP systems have solar water heating and provide all space and water heating requirements. In the data analysis that follows, I use the total energy consumed by the ASHPs for both space and water heating. [Note: for 2022, the electrical energy (kWh) use for water heating was between 16% and 17% of total energy use for both ASHPs].
The relationship between ASHP energy use (kWh) and HDDs is plotted below for each individual ASHP and the Combined Total (Main House + Annexe). The best fit of the data for all three datasets, based on the correlation coefficient (R²), was a polynomial (n=2).
%20vs%20HDDs%20for%20Main%20House,%20Annexe%20and%20Combined%20.png) |
| Correlation of ASHP Energy Use vs Heating Degree Days (℃) |
For brevity, let's just consider the data for the combined total energy use (Main House + Annexe). The following three plots show relationships for linear, exponential and polynomial (n=2) fits ...


%20Correlation.png)
- The small increase in energy use in 2022 over 2020 may be explained by a change in the heating programme used in both the main house and the annexe.
- In 2020, the daytime thermostat (0600 to 2200) was set to 18 ℃ and reduced to 16 ℃ overnight (2200 to 0600) in the main house; indoor temperatures were boosted to 20 ℃ on cold days between 0800 and 2200 hours.
- In 2020, the Annexe thermostat was set at 16 ℃ and re-programmed to higher temperatures (18 ℃ to 20 ℃) only when we had guests staying
- For 2022, a base temperature of 18 ℃ was set for the whole 24 hours in both the Main House and the Annexe. The Main house was boosted (0900 to 2200 hours) to 20 ℃ during the colder months while the Annexe was only boosted (18 ℃ to 20 ℃) when guests stayed.
- There was only a minor increase in energy use (~3%) when maintaining a constant 24-hour background temperature of 18 ℃ instead of 16 ℃ in both the Main House and the Annexe. Possibly because the ASHP works more efficiently when (i) trying to maintain a constant 24-hour temperature, and (ii) when boosting from 18 ℃ to 20 ℃ instead of 16 ℃ to 20 ℃. Simple is often best - just ask Occam.
- I should also mention that our woodburner stove was used more frequently in 2020 to provide extra thermal input. In 2022, it has only been lit twice so far this winter because it has not been required due to the higher baseline thermostat settings.


0 comments:
Post a Comment