There are times when a cheap and ready supply of 'pure' water would be handy. For example, watering indoor plants, topping up the car window-wash reservoir and radiator, cleaning and storage of cuvettes used for river water analysis, cleaning/rinsing conductivity and pH meters, and replenishing/topping-up the goldfish tank. In Part 1 of this series, I will discuss the 'purity' of the tap water supplied to our house. In Part 2, I will evaluate whether the 'distillate' from a tumble dryer produces a higher purity water sample. Part 3 will address the costs and sustainability of this option.
Our potable water is supplied by Welsh Water (Dŵr Cymru) from the Broomy Hill Water Treatment Works. I've already done a couple of blog posts on the benefits of installing a water meter and our rate of water usage.
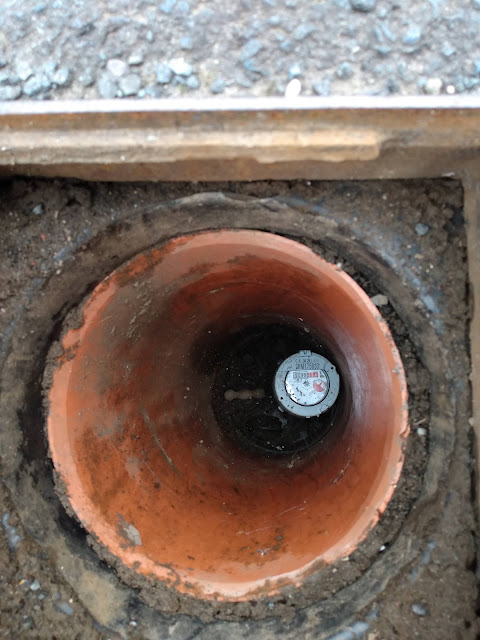 |
| Photo 1: Our Water Meter |
In this post, I want to look at the quality of the water supplied to our house. In the UK, all water companies must analyse their water on a
daily basis and you can find typical results on their website (you can request the daily test results free of charge). Simply type 'water quality' into the search function on the website of your supplier - you might need to identify your location if your supplier has different water sources and/or water treatment plants.
Welsh Water provides two lots of information: first, the '
hardness' of the water ...
 |
| Figure 1: Water Hardness Data |
Figure 1 provides a breakdown of the various water hardness parameters for the supply to our particular area. Our potable water is described as '
moderately soft' - this is a qualitative description on an arbitrary scale from very soft to very hard. Figure 2 shows the water 'hardness' data for
England and Wales, with Herefordshire highlighted.
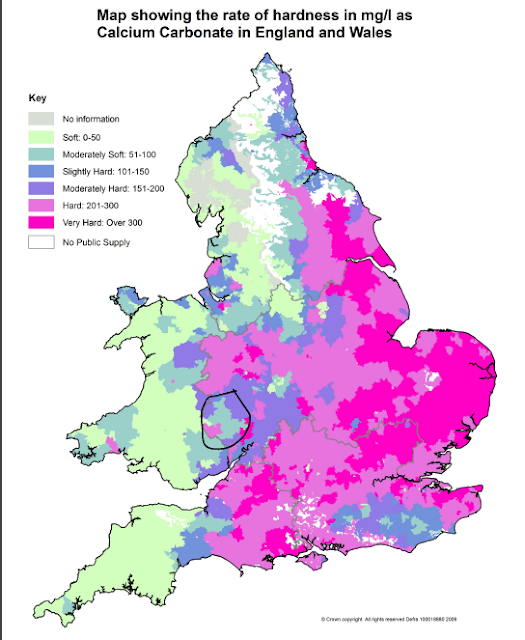 |
| Figure 2: Water Hardness (mg/L CaCO3) courtesy of DEFRA |
To convert calcium (mg/L) to calcium carbonate (mg/L), the former needs to be multiplied by 2.5. So, our water has a hardness of 27.58 x 2.5 = 69 (i.e. moderately soft). Do not worry about the different values for hardness given in Figure 1. These arise because of different methods used to determine water 'hardness' (e.g. colorimetric titration, elemental analysis by atomic absorption spectroscopy and gravimetry) and the inclusion/exclusion of other inorganic species (e.g. magnesium carbonate) that cause water 'hardness'.
Hard water leads to a build-up of scale in heating appliances (kettles, washing machines, diswashers, boilers, etc), leaves 'tidemarks' in baths, sinks and toilets, and produces a surface 'scum' on hot beverages. We came across a couple who regularly visited the
Malvern springs and wells to stock up with water and take it back to Oxfordshire where they now lived. It was, apparently, impossible to make a decent cup of tea with the hard/very hard water supplied in Oxfordshire!!
On the other hand,
soft water is more corrosive to metal pipework than hard water and phosphate salts may be added to control the corrosion. Which leads nicely onto the second set of analyses carried out by water companies; namely, taste, smell and appearance, acidity (pH), and levels of inorganics (including heavy metal pollutants), organics (e.g. PAHs and pesticides) and bacterial colonies. Some typical values for selected parameters are:
pH 7.61
Nitrite 0.01 mg/L
Nitrate 4.92 mg/L
Ammonium 8.4 μg/L
Phosphorus 572.50 μg/L
Orthophosphate 1.75 mg/L
The reasons for choosing these parameters will be become clear below.
Through my
citizen science activities, I have the means to directly test for all the above properties with the exception of elemental phosphorus. Fortunately, dividing the measured orthophosphate, [PO₄]³⁻, concentration by 3.066 will yield the elemental phosphorus value for the sample. Conversely, the elemental phosphorus content when multiplied by 3.066 will give the orthophosphate concentration.
[Note: the conductivity and pH meters both have automatic temperature compensation (ATC) so values are corrected to 25 ℃]
Table 1 summarises my home test results and compares them with the expected or typical values reported by the water company. The agreement is excellent.
Table 1: Comparison of Measured vs Typical Test Results for Home Tap Water (Hereford)
Analytical Test | Measured Value | ‘Typical’ Values |
Orthophosphate | 1.94 mg/L (ppm) | 1.75 mg/L |
Nitrite | 0 mg/L (ppm) | 0.01 mg/L |
Nitrate | 2 mg/L (ppm) | 5.4 mg/L |
NH3-N (ammoniacal nitrogen) | 0.00 mg/L (ppm) | 0.007 mg/L (calculated) |
Ammonium | 0 mg/L (ppm) | 0.009 mg/L |
pH | 7.8 | 7.6 |
Conductivity | 207 μS/cm (25 oC) | 199.6 μS/cm (20 oC) |
[
Note: pH and conductivity both vary with temperature; the former decreases and the latter increases with increasing temperature. To standardise measurements, pH and conductivity values are 'corrected' to a standard temperature, usually 25 ℃. Meters with ATC do this compensation automatically using the built-in thermometer. While most procedures and regulations report conductivity at 25 ℃, the UK Water Quality Supply Regulations use a standard temperature of 20 ℃.]
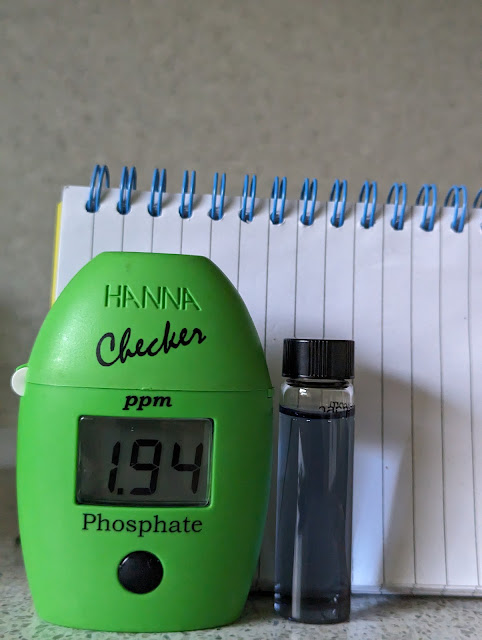 |
| Photo 2: Orthophosphate Value for Hereford Tap Water |
Welsh Water add phosphate to the Hereford tap water to reduce pipework corrosion. The concentration of phosphate (usually between 1.5 mg/L and 2.0 mg/L) in the potable water will have a very small fertilizer effect when watering plants/lawns etc; however, the levels are about 30 times lower than a foliar feed such as that used in the
Greenhouse Sensation Quadgrow system. Nitrite/nitrate concentrations in the tap water are about 200 times more dilute than a foliar feed.


0 comments:
Post a Comment